Run Tracing
In the Trace page of the Studio sidebar, you can view detailed information about run tracing, including inputs and outputs of various modules, tool call information, execution time, and other runtime information.
This feature is built on the OpenTelemetry semantic conventions and OTLP protocol. It not only provides out-of-the-box reception and storage of various observability information reported by AgentScope, but also supports integration of data reported by any collection tools/AI application frameworks based on OpenTelemetry or LoongSuite.
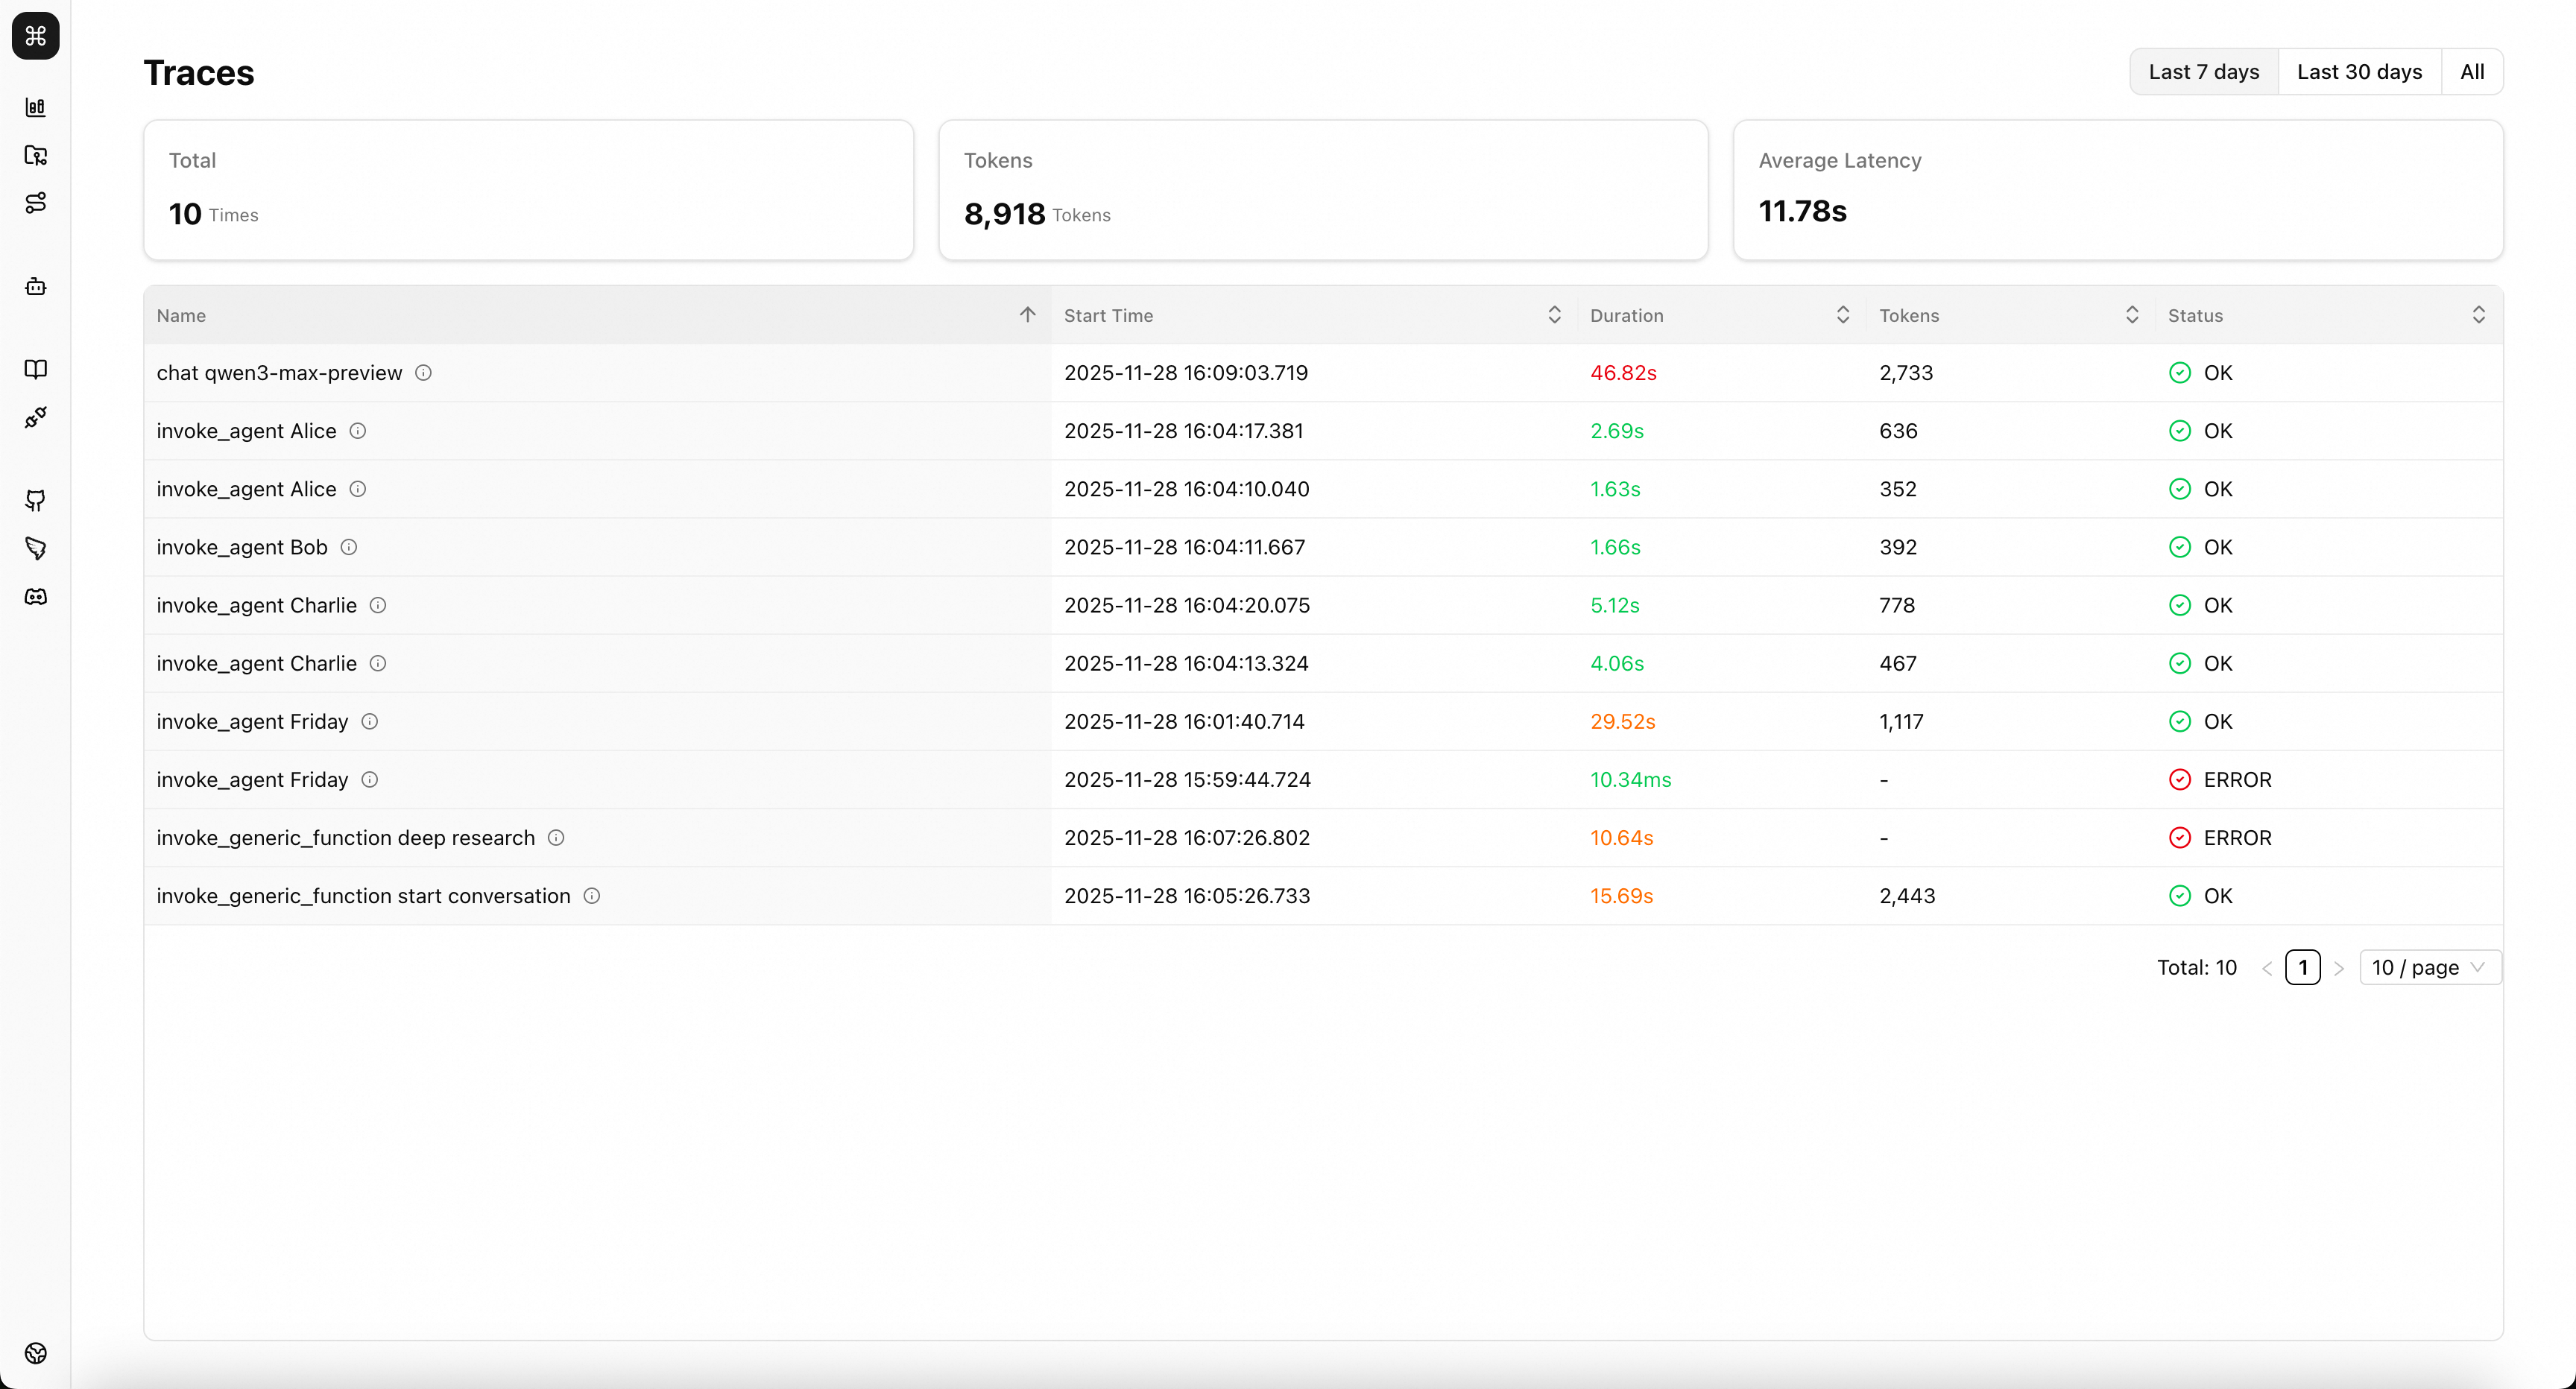
Overview Page
On this page, you can view basic information about trace data reported to Studio.
💡 Tip: Hover your mouse over the icon next to the trace name to view basic metadata of that trace, such as Trace ID.
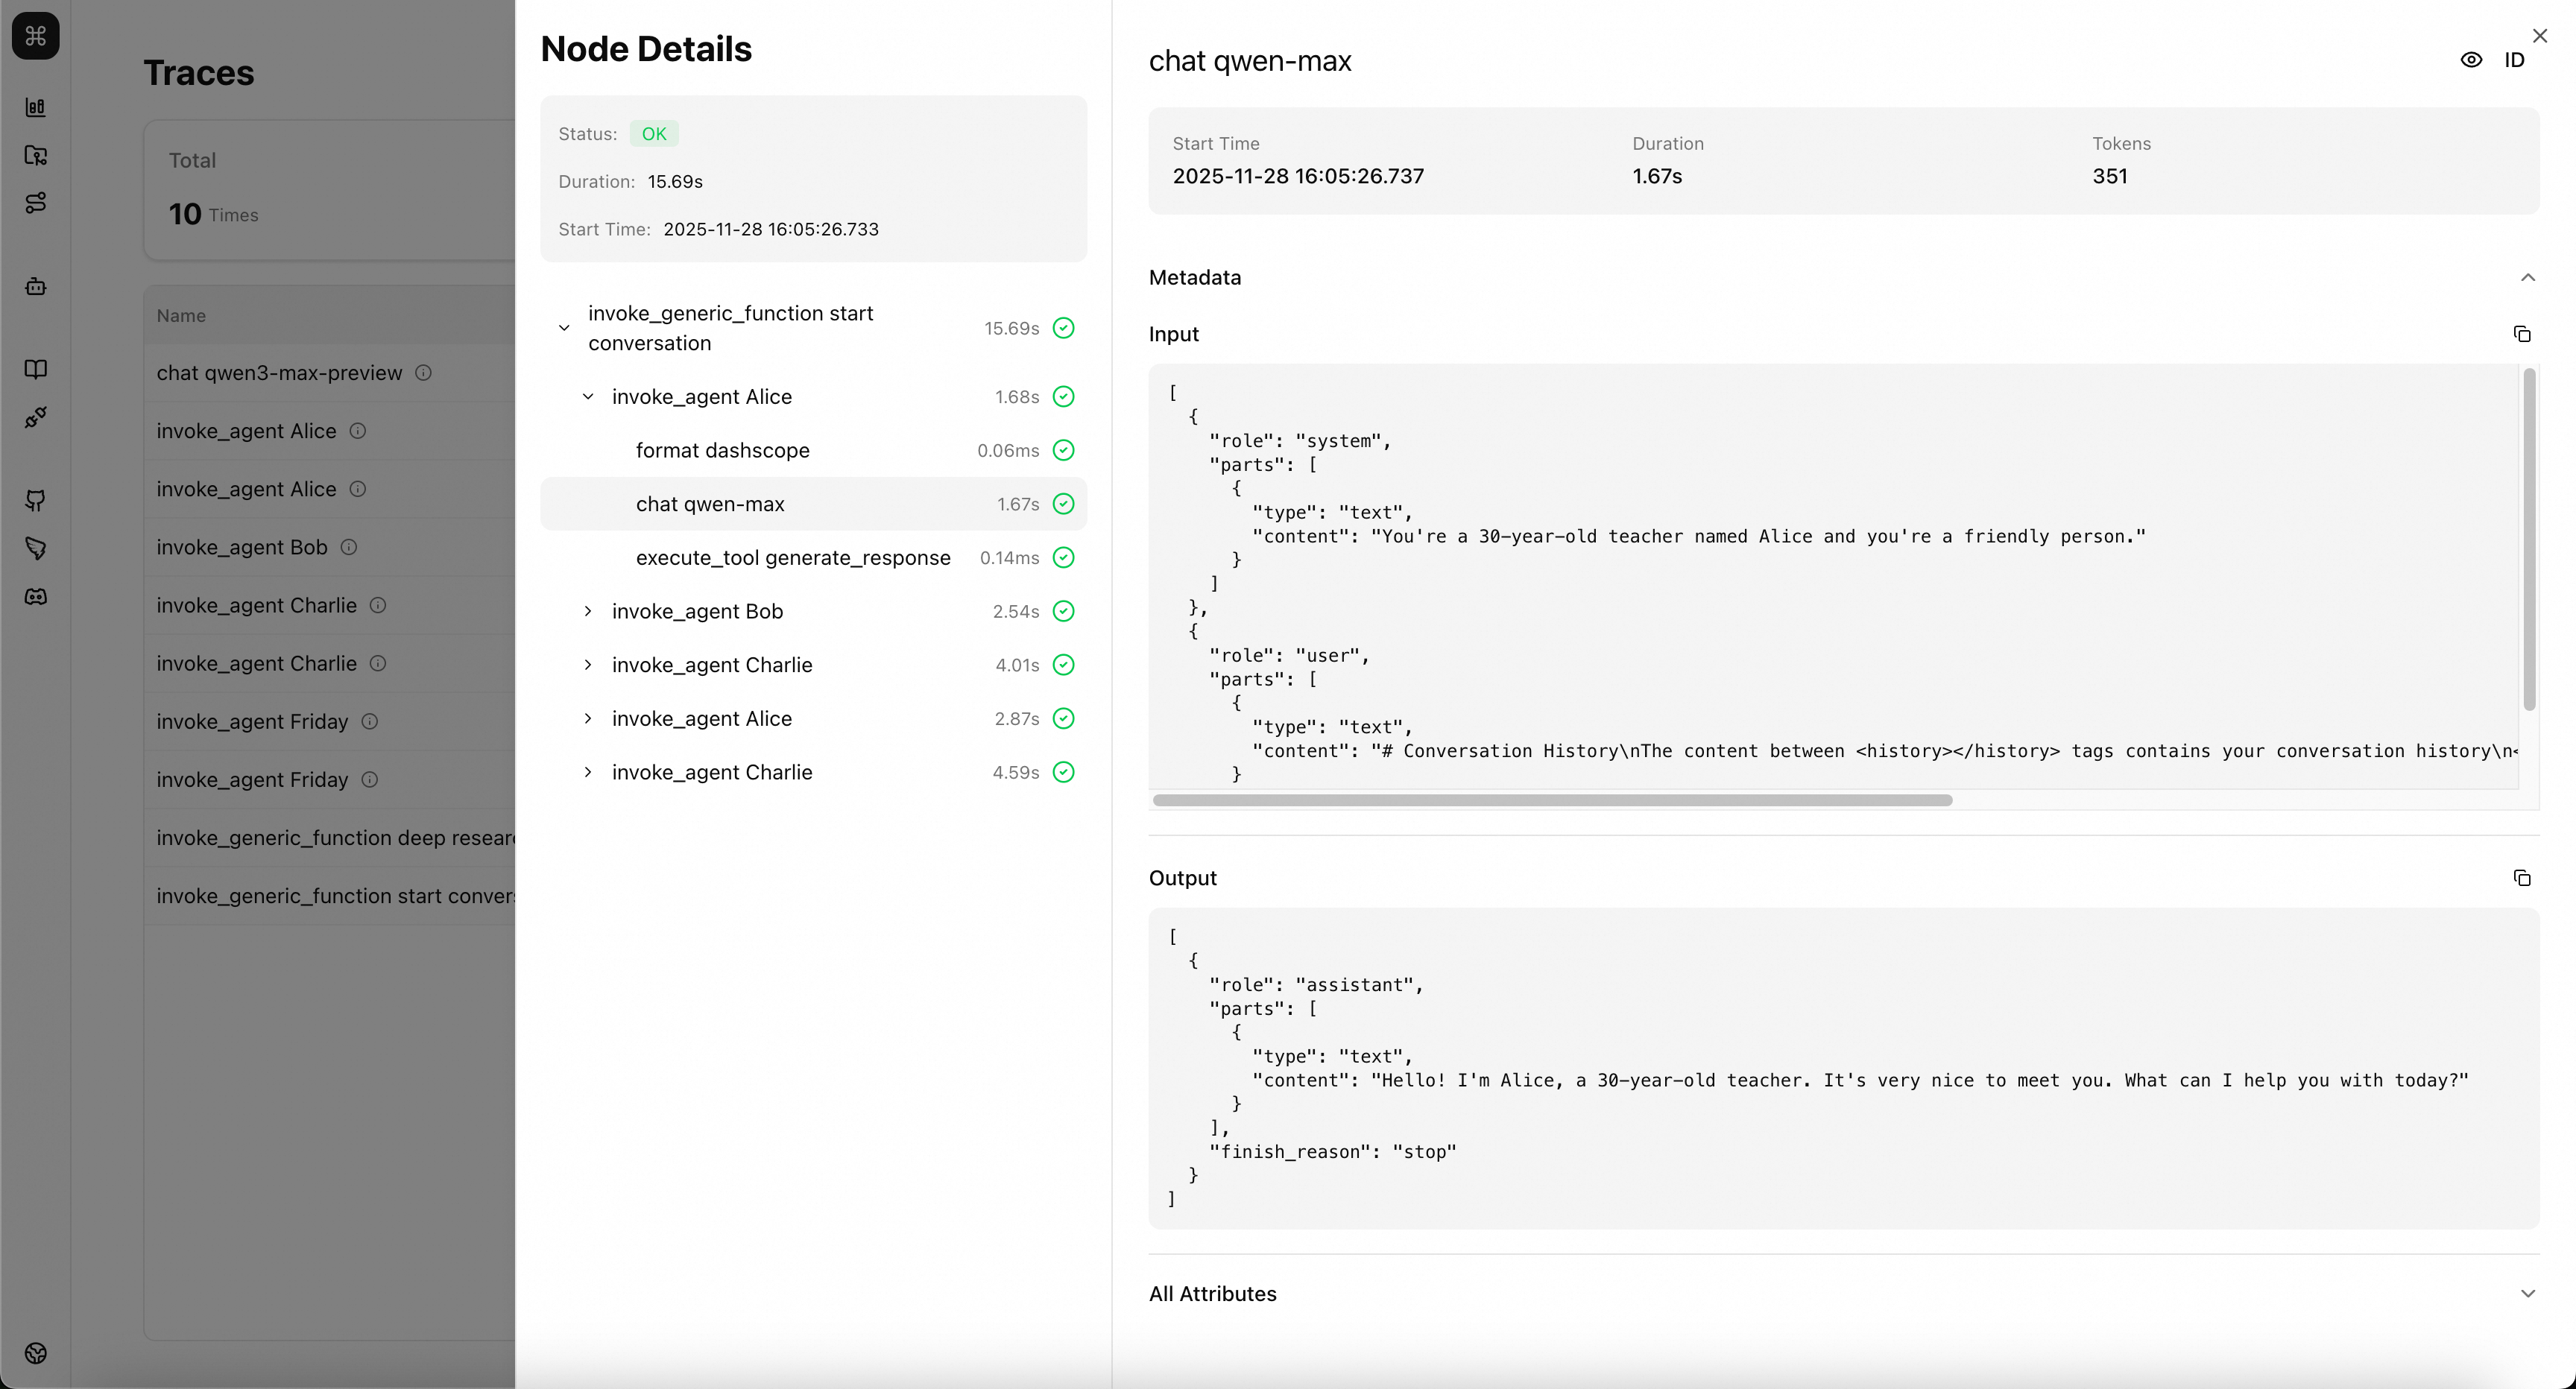
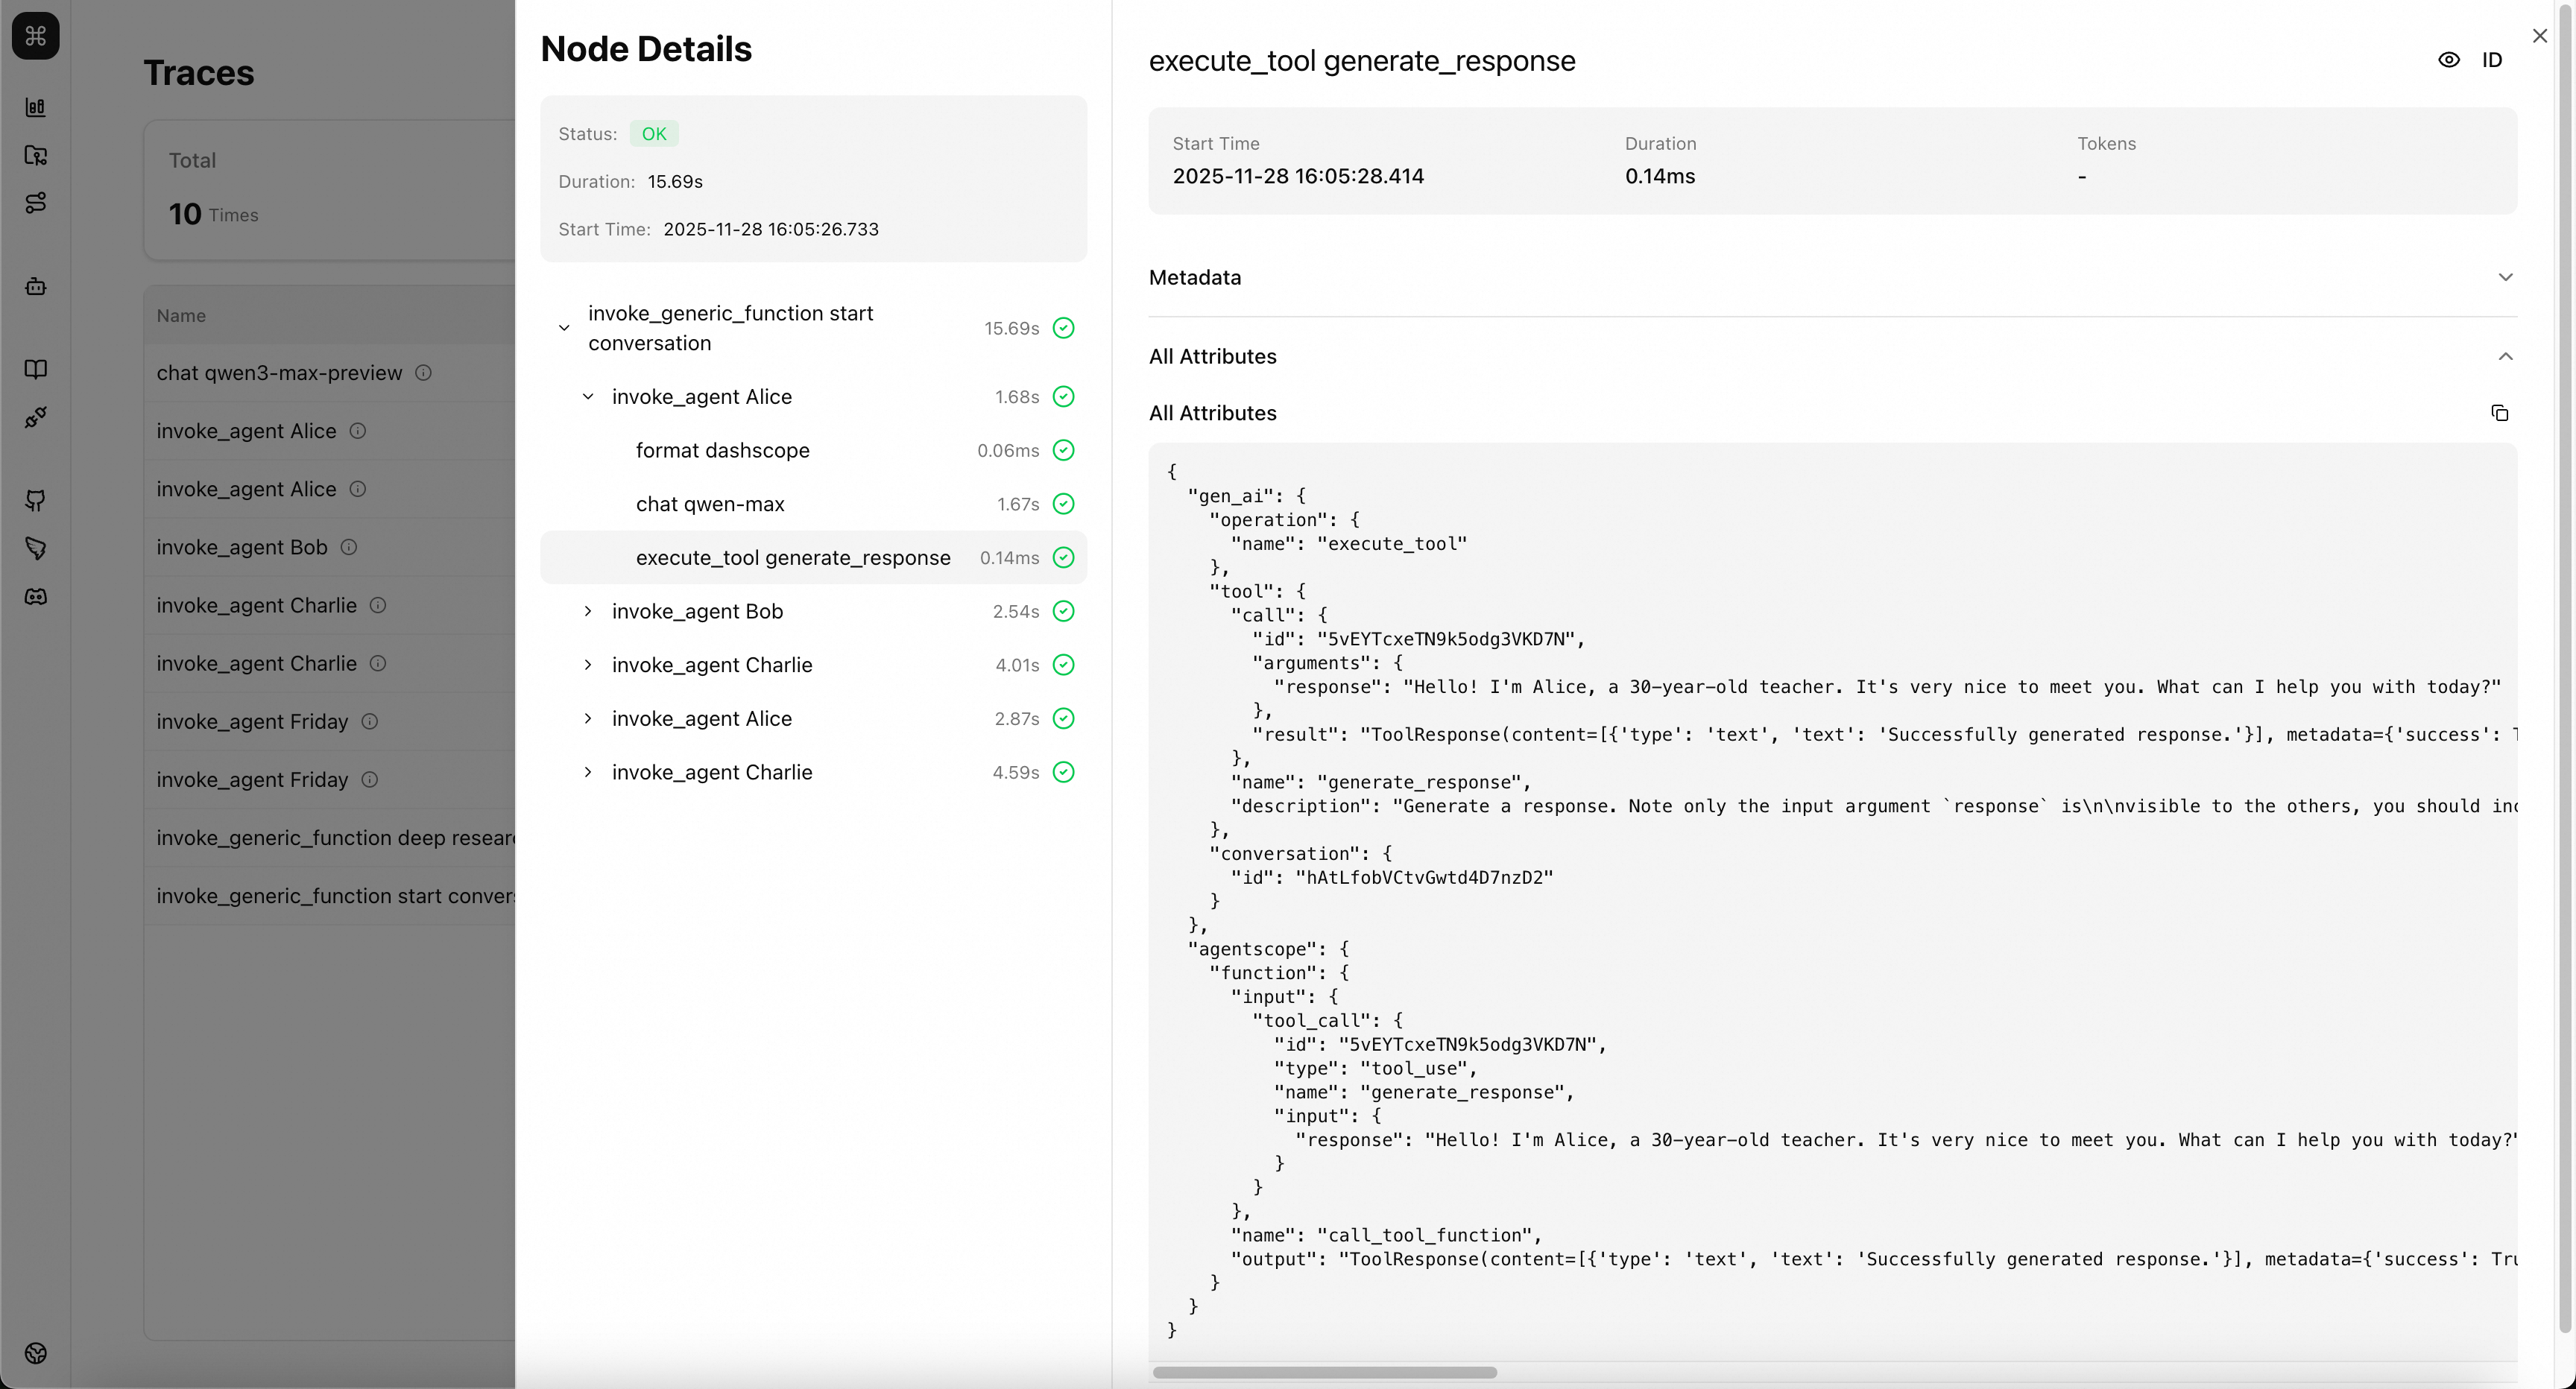
Details Page
Click on any trace in the overview page to view the call sequence and call relationships of that trace. Further select calls at different levels to see detailed context when these calls occurred.
In the Metadata area, you can view the input and output of calls. For AI-related calls, such as LLM, Agent, etc., inputs and outputs will be displayed according to the structure defined by the OpenTelemetry semantic conventions. For regular calls, such as Function, Format, etc., inputs and outputs will be displayed according to the AgentScope extended semantic conventions.
In the All Attributes area, you can see all key metadata of this call, with naming following the semantic conventions.
Semantic Conventions
AgentScope-Studio's observability data follows semantic conventions based on OpenTelemetry. Data following these semantic conventions will receive more accurate and clear processing and display in Studio.
💡 Tip: The native observability capabilities of the AgentScope library already follow these semantic conventions. Even if observability data from other sources does not yet follow these semantic conventions, trace data can still be displayed normally, but some key information may not be highlighted/specially displayed.
OpenTelemetry Generative AI
OpenTelemetry provides a set of semantic convention standards for observability data of Generative AI applications. For detailed definitions, see Semantic conventions for generative client AI spans and Semantic Conventions for GenAI agent and framework spans.
💡 Tip: Studio currently follows OpenTelemetry semantic conventions version 1.38.0.
Current semantic conventions include:
- Inference: model calls
- Invoke agent span: agent calls
- Execute tool span: toolkit calls
AgentScope Extended Conventions
In addition to various semantic conventions defined in OpenTelemetry, AgentScope has extended semantic conventions for some specific call processes to display the call process more clearly.
Common Call
Applicable to all key call processes occurring in AI applications.
| Key | Requirement Level | Value Type | Description | Example Values |
|---|---|---|---|---|
agentscope.function.name | Recommended | string | The name of the method/function called. | DashScopeChatModel.__call__; ToolKit.callTool |
agentscope.function.input | Opt-In | string | The input of the method/function. [1] | { "tool_call": { "type": "tool_use", "id": "call_83fce0d1d2684545a13649", "name": "multiply", "input": { "a": 5, "b": 3 } } } |
agentscope.function.output | Opt-In | string | The return value of the method/function. [2] | ToolResponse(content=[{'type': 'text', 'text': '5 × 3 = 15'}], metadata=None, stream=False, is_last=True, is_interrupted=False, id='2025-11-28 00:38:52.733_cc4ead') |
[1] agentscope.function.input: Method/function input parameters. Must be serialized in JSON format.
[2] agentscope.function.output: The return value of the method/function. Serialized in JSON or toString format.
Format Call
This span represents the preparation and formatting process of the request before initiating a model call. In AgentScope, this method corresponds to the invocation of the Formatter tool.
gen_ai.operation.name should be format.
Span name should be format {agentscope.format.target}.
Span kind should be INTERNAL.
Span status should follow the recording errors documentation.
Attributes:
| Key | Requirement Level | Value Type | Description | Example Values |
|---|---|---|---|---|
gen_ai.operation.name | Required | string | The name of the operation being performed. | chat; generate_content; text_completion |
error.type | Conditionally Required if the operation ended in an error | string | The error thrown when the operation aborted. | timeout; java.net.UnknownHostException; server_certificate_invalid; 500 |
agentscope.format.target | Required | string | The target type to format to. If the target type cannot be resolved, set to 'unknown'. | dashscope; openai |
agentscope.format.count | Recommended | int | The actual number of messages formatted. [1] | 3 |
agentscope.function.name | Recommended | string | The name of the method/function called. | DashScopeChatModel.__call__; ToolKit.callTool |
agentscope.function.input | Opt-In | string | The input of the method/function. [2] | { "tool_call": { "type": "tool_use", "id": "call_83fce0d1d2684545a13649", "name": "multiply", "input": { "a": 5, "b": 3 } } } |
agentscope.function.output | Opt-In | string | The return value of the method/function. [3] | ToolResponse(content=[{'type': 'text', 'text': '5 × 3 = 15'}], metadata=None, stream=False, is_last=True, is_interrupted=False, id='2025-11-28 00:38:52.733_cc4ead') |
[1] agentscope.format.count: The actual number of messages formatted. The value is consistent with the size of the message list returned after the formatting function is executed. If truncation or message trimming is performed during formatting, this value may be less than the size of the incoming message list.
[2] agentscope.function.input: Method/function input parameters. Must be serialized in JSON format.
[3] agentscope.function.output: The return value of the method/function. Serialized in JSON or toString format.
Function Call
This span represents the process of initiating any key call. In AgentScope, this method corresponds to the execution process of regular functions, and only takes effect when users add trace tracking capability to methods/functions through the methods provided by AgentScope.
gen_ai.operation.name should be invoke_generic_function.
Span name should be invoke_generic_function {agentscope.function.name}.
Span kind should be INTERNAL.
Span status should follow the recording errors documentation.
Attributes:
| Key | Requirement Level | Value Type | Description | Example Values |
|---|---|---|---|---|
gen_ai.operation.name | Required | string | The name of the operation being performed. | chat; generate_content; text_completion |
error.type | Conditionally Required if the operation ended in an error | string | The error thrown when the operation aborted. | timeout; java.net.UnknownHostException; server_certificate_invalid; 500 |
agentscope.function.name | Recommended | string | The name of the method/function called. | DashScopeChatModel.__call__; ToolKit.callTool |
agentscope.function.input | Opt-In | string | The input of the method/function. [1] | { "tool_call": { "type": "tool_use", "id": "call_83fce0d1d2684545a13649", "name": "multiply", "input": { "a": 5, "b": 3 } } } |
agentscope.function.output | Opt-In | string | The return value of the method/function. [2] | ToolResponse(content=[{'type': 'text', 'text': '5 × 3 = 15'}], metadata=None, stream=False, is_last=True, is_interrupted=False, id='2025-11-28 00:38:52.733_cc4ead') |
[1] agentscope.function.input: Method/function input parameters. Must be serialized in JSON format.
[2] agentscope.function.output: The return value of the method/function. Serialized in JSON or toString format.
Integration
AgentScope Studio provides services that comply with the OpenTelemetry Protocol (OTLP) specification.
By default, after AgentScope Studio starts, it exposes the following service endpoints:
- OTLP/Trace/gRPC:
localhost:4317, you can adjust the gRPC service endpoint by modifying theOTEL_GRPC_PORTenvironment variable. - OTLP/Trace/HTTP:
localhost:3000, you can adjust the HTTP service endpoint by modifying thePORTenvironment variable.
💡 Tip: Studio currently only supports receiving Trace type data.
AgentScope Application Integration
The AgentScope framework natively supports Trace data collection and export. You can add some additional code to your application to implement Trace data reporting.
AgentScope Python Application
Add the following initialization code before your application code.
import agentscope

agentscope.init(studio_url="http://localhost:3000") # Replace this with Studio's HTTP service endpoint

# your application code
AgentScope Java Application
- Introduce the dependencies required to connect to Studio in your project.
maven:
<dependency>
  <groupId>io.agentscope</groupId>
  <artifactId>agentscope-extensions-studio</artifactId>
</dependency>
gradle:
implementation("io.agentscope:agentscope-extensions-studio")- Add the following initialization code before your application code.
public static void main() {
  StudioManager.init()
    .studioUrl("http://localhost:3000")
    .initialize()
    .block();

  // your application code
}
LoongSuite/OpenTelemetry Agent Integration
LoongSuite agents are non-intrusive observability data collection tools for multi-language AI applications, developed by the Alibaba Cloud Cloud Native team based on OpenTelemetry agents. These agents achieve non-intrusive observability through compile-time/runtime code enhancement mechanisms by completing code instrumentation of application code.
The data collected by LoongSuite agents and OpenTelemetry agents are both exported using OTLP Exporter, so they can be directly received and stored by AgentScope Studio. Currently supported agents include:
- LoongSuite Python Agent
- LoongSuite Go Agent
- LoongSuite Java Agent
- OpenTelemetry Python Agent
- OpenTelemetry Java Agent
- OpenTelemetry JavaScript Agent
- ...(Any other data collectors that support OTLP Exporter)
LoongSuite Python Agent Integration
- Refer to the LoongSuite Python Agent official documentation to install the agent
- Modify the startup parameters to export data to AgentScope Studio. Please replace
exporter_otlp_endpointwith your Studio's gRPC service address
loongsuite-instrument \
    --traces_exporter otlp \
    --metrics_exporter console \
    --service_name your-service-name \
    --exporter_otlp_endpoint 0.0.0.0:4317 \
    python myapp.py
OpenTelemetry Java Agent Integration
- Refer to the OpenTelemetry Java Agent official documentation to install the agent
- Modify the startup parameters to export data to AgentScope Studio. Please replace
otel.exporter.otlp.traces.endpointwith your Studio's gRPC service address
java -javaagent:path/to/opentelemetry-javaagent.jar \
     -Dotel.resource.attributes=service.name=your-service-name \
     -Dotel.traces.exporter=otlp \
     -Dotel.metrics.exporter=console \
     -Dotel.exporter.otlp.traces.endpoint=http://localhost:4317 \
     -jar myapp.jar
Advanced Integration: Import Custom Trace Data
If you need to export observability data from any source as trace data to AgentScope Studio, you can assemble the data according to the OTLP protocol. AgentScope Studio receives trace data encoded in Protobuf format and provides both HTTP and gRPC services. The service exposure methods follow the OTLP/HTTP and OTLP/gRPC conventions, and the data body follows the OTLP Protobuf definition.
Export Data Using OTLP Exporter
To ensure data correctness, it is strongly recommended that you use OTLP Exporter for data export. You can find more detailed tutorials in the OTLP official documentation. Here is an OTLP Exporter example in Python:
💡 Tip: This section partially references the OpenTelemetry Python API.
Create an OTLP Exporter and initialize TracerProvider:
from opentelemetry.sdk.trace import TracerProvider
from opentelemetry.sdk.trace.export import BatchSpanProcessor
from opentelemetry.exporter.otlp.proto.http.trace_exporter import (
    OTLPSpanExporter,
)

tracer_provider = TracerProvider()
# OTLP/HTTP for OpenTelemetry Python SDK by default
exporter = OTLPSpanExporter(endpoint="http://localhost:3000")
span_processor = BatchSpanProcessor(exporter)
tracer_provider.add_span_processor(span_processor)
Use TracerProvider to create a Tracer and build Span:
# create tracer
tracer = tracer_provider.get_tracer("test_module", "1.0.0")

# create span
# attributes maybe set here
with tracer.start_as_current_span("test") as span:
    try:
        # do something
        # attributes may be set here
        span.set_attributes({"test_key": "test_value"})
        span.set_status(trace_api.StatusCode.OK)
        return res

    except Exception as e:
        span.set_status(
            trace_api.StatusCode.ERROR,
            str(e),
        )
        span.record_exception(e)
        raise e from None