Observability (OpenTelemetry)
TuFT includes optional OpenTelemetry integration for:
Traces (distributed tracing across HTTP → controllers → Ray actors)
Metrics (request/workflow + resource metrics)
Logs (Python logging bridged into the OpenTelemetry log pipeline)
This document explains both how to enable telemetry and how TuFT wires it internally (what gets recorded, correlation keys, and how to extend instrumentation).
Table of Contents
Quick start
Enable telemetry in tuft_config.yaml:
telemetry:
  enabled: true
  service_name: tuft
  otlp_endpoint: http://localhost:4317
  resource_attributes:
    deployment.environment: production
    service.version: 1.0.0
Note:
resource_attributesallows you to attach custom metadata to all telemetry data. Common attributes include:
deployment.environment: e.g.,production,staging,development
service.version: your application version
service.namespace: logical grouping of services
host.name: hostname of the machineCustom attributes for your organization (e.g.,
team,region)
Alternatively set the endpoint via env var:
export TUFT_OTLP_ENDPOINT=http://localhost:4317
Debug mode (prints to console exporters):
export TUFT_OTEL_DEBUG=1
Exporters and configuration
TuFT initializes OpenTelemetry providers at CLI startup and uses one of two exporter modes:
Console exporters if
TUFT_OTEL_DEBUG=1OTLP gRPC exporters otherwise
The endpoint resolution order is:
telemetry.otlp_endpointfrom configTUFT_OTLP_ENDPOINTenvironment variableOpenTelemetry exporter default endpoint (if neither is provided)
TuFT exports:
traces via
OTLPSpanExporter(gRPC)metrics via
OTLPMetricExporter(gRPC)logs via
OTLPLogExporter(gRPC)
Resource metadata:
service.nameis set totelemetry.service_nameadditional resource attributes can be attached via
telemetry.resource_attributes
What TuFT records
Traces
TuFT produces spans at several layers:
HTTP server spans: FastAPI is instrumented when telemetry is enabled.
Controller spans: training/sampling operations create spans such as:
training_controller.create_modeltraining_controller.run_forwardtraining_controller.run_forward_backwardtraining_controller.run_optim_steptraining_controller.save_checkpointsampling_controller.create_sampling_sessionsampling_controller.run_samplefuture_store.execute_operation
Persistence spans: Redis operations create spans such as:
redis.SET,redis.GET,redis.DEL,redis.SCAN
Backend / actor spans (when running with Ray):
spans inside model actors (e.g. HuggingFace backend) are linked via propagated context
examples include
hf_model.forward_backward,hf_model.optim_step,hf_model.save_state, etc.
TuFT attaches key identifiers as span attributes (see Correlation / share keys).
Metrics
TuFT emits two broad categories of metrics:
1) Workflow metrics (counters/histograms)
Examples (names are stable and can be used as dashboards/alerts):
Training:
tuft.training.models.active(up/down counter)tuft.training.tokens_per_second(histogram)tuft.training.checkpoints.saved(counter)tuft.training.checkpoint.size_bytes(histogram)
Sampling:
tuft.sampling.sessions.active(up/down counter)tuft.sampling.requests(counter)tuft.sampling.duration(histogram, seconds)tuft.sampling.tokens_per_second(histogram)tuft.sampling.output_tokens(histogram)
Futures:
tuft.futures.queue_length(up/down counter)tuft.futures.created(counter)tuft.futures.completed(counter)tuft.futures.wait_time(histogram)tuft.futures.execution_time(histogram)
Persistence:
tuft.redis.operation.duration(histogram)
Many metrics include attributes such as base_model, operation_type, model_id, or queue_state to support filtering and grouping.
2) Resource metrics (observable gauges)
When telemetry is enabled, TuFT starts a background resource collector that exports observable gauges such as:
CPU:
tuft.resource.cpu.utilization_percent
Memory:
tuft.resource.memory.used_bytestuft.resource.memory.total_bytestuft.resource.memory.utilization_percent
GPU (if NVML is available):
tuft.resource.gpu.utilization_percent(with attributegpu_id)tuft.resource.gpu.memory_used_bytes(with attributegpu_id)tuft.resource.gpu.memory_total_bytes(with attributegpu_id)
Process:
tuft.resource.process.memory_used_bytes
Logs
TuFT bridges Python logging into OpenTelemetry:
log records are exported via the configured OTel log provider
existing logging handlers are not removed (OTel handler is added)
Context propagation (Ray actors)
When TuFT executes work inside Ray actors, it propagates the OpenTelemetry context explicitly:
At the controller/backend boundary, TuFT injects the current trace context into a serializable dict.
The Ray actor side extracts that context and starts child spans under that context.
This provides end-to-end traces that cross process boundaries even when Ray scheduling changes the execution location.
Developer guide
Creating spans
Use get_tracer() and standard OpenTelemetry span APIs:
from tuft.telemetry.tracing import get_tracer

tracer = get_tracer("tuft.my_module")
with tracer.start_as_current_span("my_operation") as span:
    span.set_attribute("tuft.session_id", session_id)
    span.set_attribute("tuft.training_run_id", training_run_id)
    # ... your logic ...
Recording metrics
Use the centralized metrics registry:
from tuft.telemetry.metrics import get_metrics

metrics = get_metrics()
metrics.futures_created.add(1, {"operation_type": "forward_backward"})
metrics.futures_execution_time.record(0.123, {"operation_type": "forward_backward"})
Choosing attributes
Prefer:
stable identifiers (
session_id,training_run_id,sampling_session_id,request_id)low-cardinality labels for metrics (e.g.
base_model,operation_type,queue_state)
Avoid putting user prompts or raw payloads into span attributes.
Recommended collector configuration
TuFT exports OTLP over gRPC by default. We recommend running an OpenTelemetry Collector (or an observability backend that provides an OTLP receiver) listening on the configured otlp_endpoint (commonly 4317).
At minimum, ensure:
the collector has an OTLP receiver enabled (gRPC)
traces/metrics/logs pipelines are configured to accept OTLP and forward to your backend (Jaeger/Tempo, Prometheus, SigNoz, etc.)
TuFT-specific knobs:
set
telemetry.service_nameto a stable value (e.g.tuft-prod)use
telemetry.resource_attributesto tag deployments (e.g. environment, region, version)
Troubleshooting
No telemetry shows up
Ensure
telemetry.enabled: true.Ensure the OTLP endpoint is reachable from the TuFT server process.
Try debug mode to confirm instrumentation works:
export TUFT_OTEL_DEBUG=1
GPU metrics missing
GPU gauges require NVML (
pynvml) and a working NVML environment. TuFT will gracefully skip GPU metrics if unavailable.
End-to-end example
This section demonstrates running TuFT with an observability backend. We use SigNoz in this example because it provides a unified backend for traces, metrics, and logs in a single platform, making it easy to demonstrate all three observability pillars together.
Alternative backends: TuFT exports standard OTLP data and works with any OpenTelemetry-compatible backend:
Traces: Jaeger, Zipkin, Tempo, Datadog, etc.
Metrics: Prometheus (via OTLP or Prometheus exporter), Grafana Mimir, etc.
Logs: Loki, Elasticsearch, etc.
Simply point
telemetry.otlp_endpointto your preferred collector or backend.
Prerequisites
Docker and Docker Compose installed
Step 1: Start SigNoz
We recommend installing SigNoz using Docker Compose as shown below. For alternative installation methods (install script, Docker Swarm, Kubernetes, etc.), refer to the SigNoz installation guide.
git clone -b main https://github.com/SigNoz/signoz.git && cd signoz/deploy/docker
docker compose up -d --remove-orphans
SigNoz will start with an OTLP receiver on localhost:4317.
Step 2: Configure TuFT
Add the following telemetry configuration to your tuft_config.yaml:
telemetry:
  enabled: true
  service_name: tuft
  otlp_endpoint: http://localhost:4317
  resource_attributes:
    deployment.environment: demo
Step 3: Launch TuFT and run workloads
tuft launch --config /path/to/tuft_config.yaml
Run some training or sampling operations through the TuFT client to generate telemetry data.
Step 4: View in SigNoz
Open SigNoz at http://localhost:8080 to explore the collected telemetry data.
Traces
TuFT attaches structured correlation keys to every span, enabling powerful filtering in the Traces Explorer.
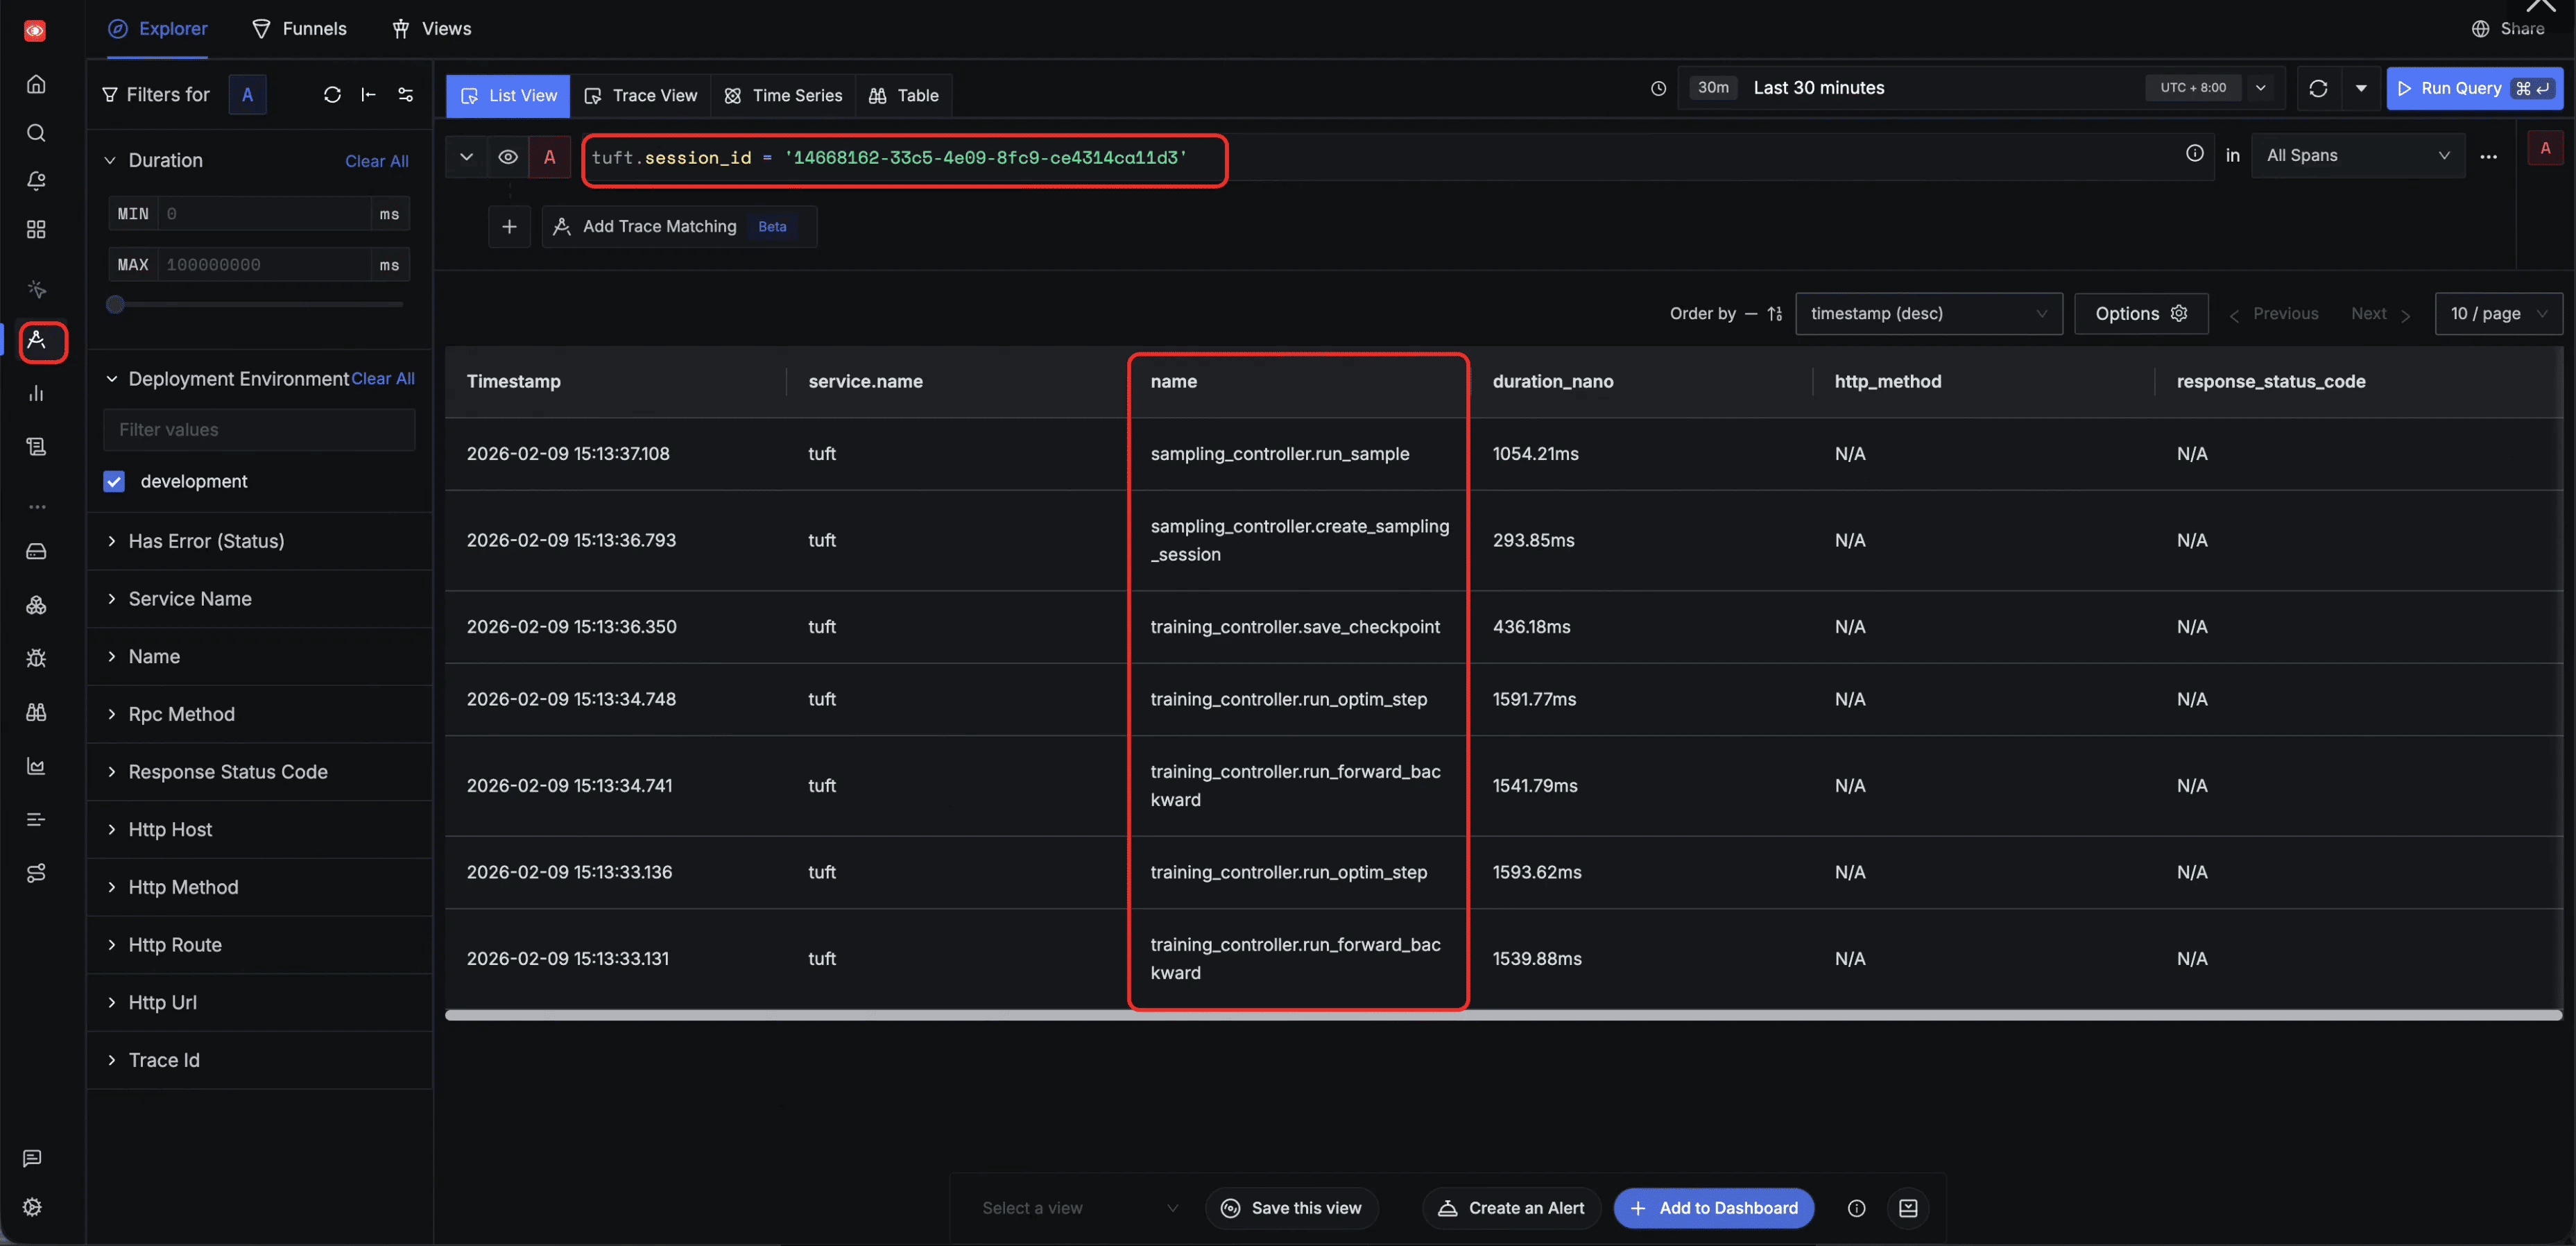
Filter by tuft.session_id — track all tasks within a single session. By filtering on a specific tuft.session_id, the Explorer surfaces every span across both training and sampling operations initiated in that session, providing a holistic view of all session-level activity:
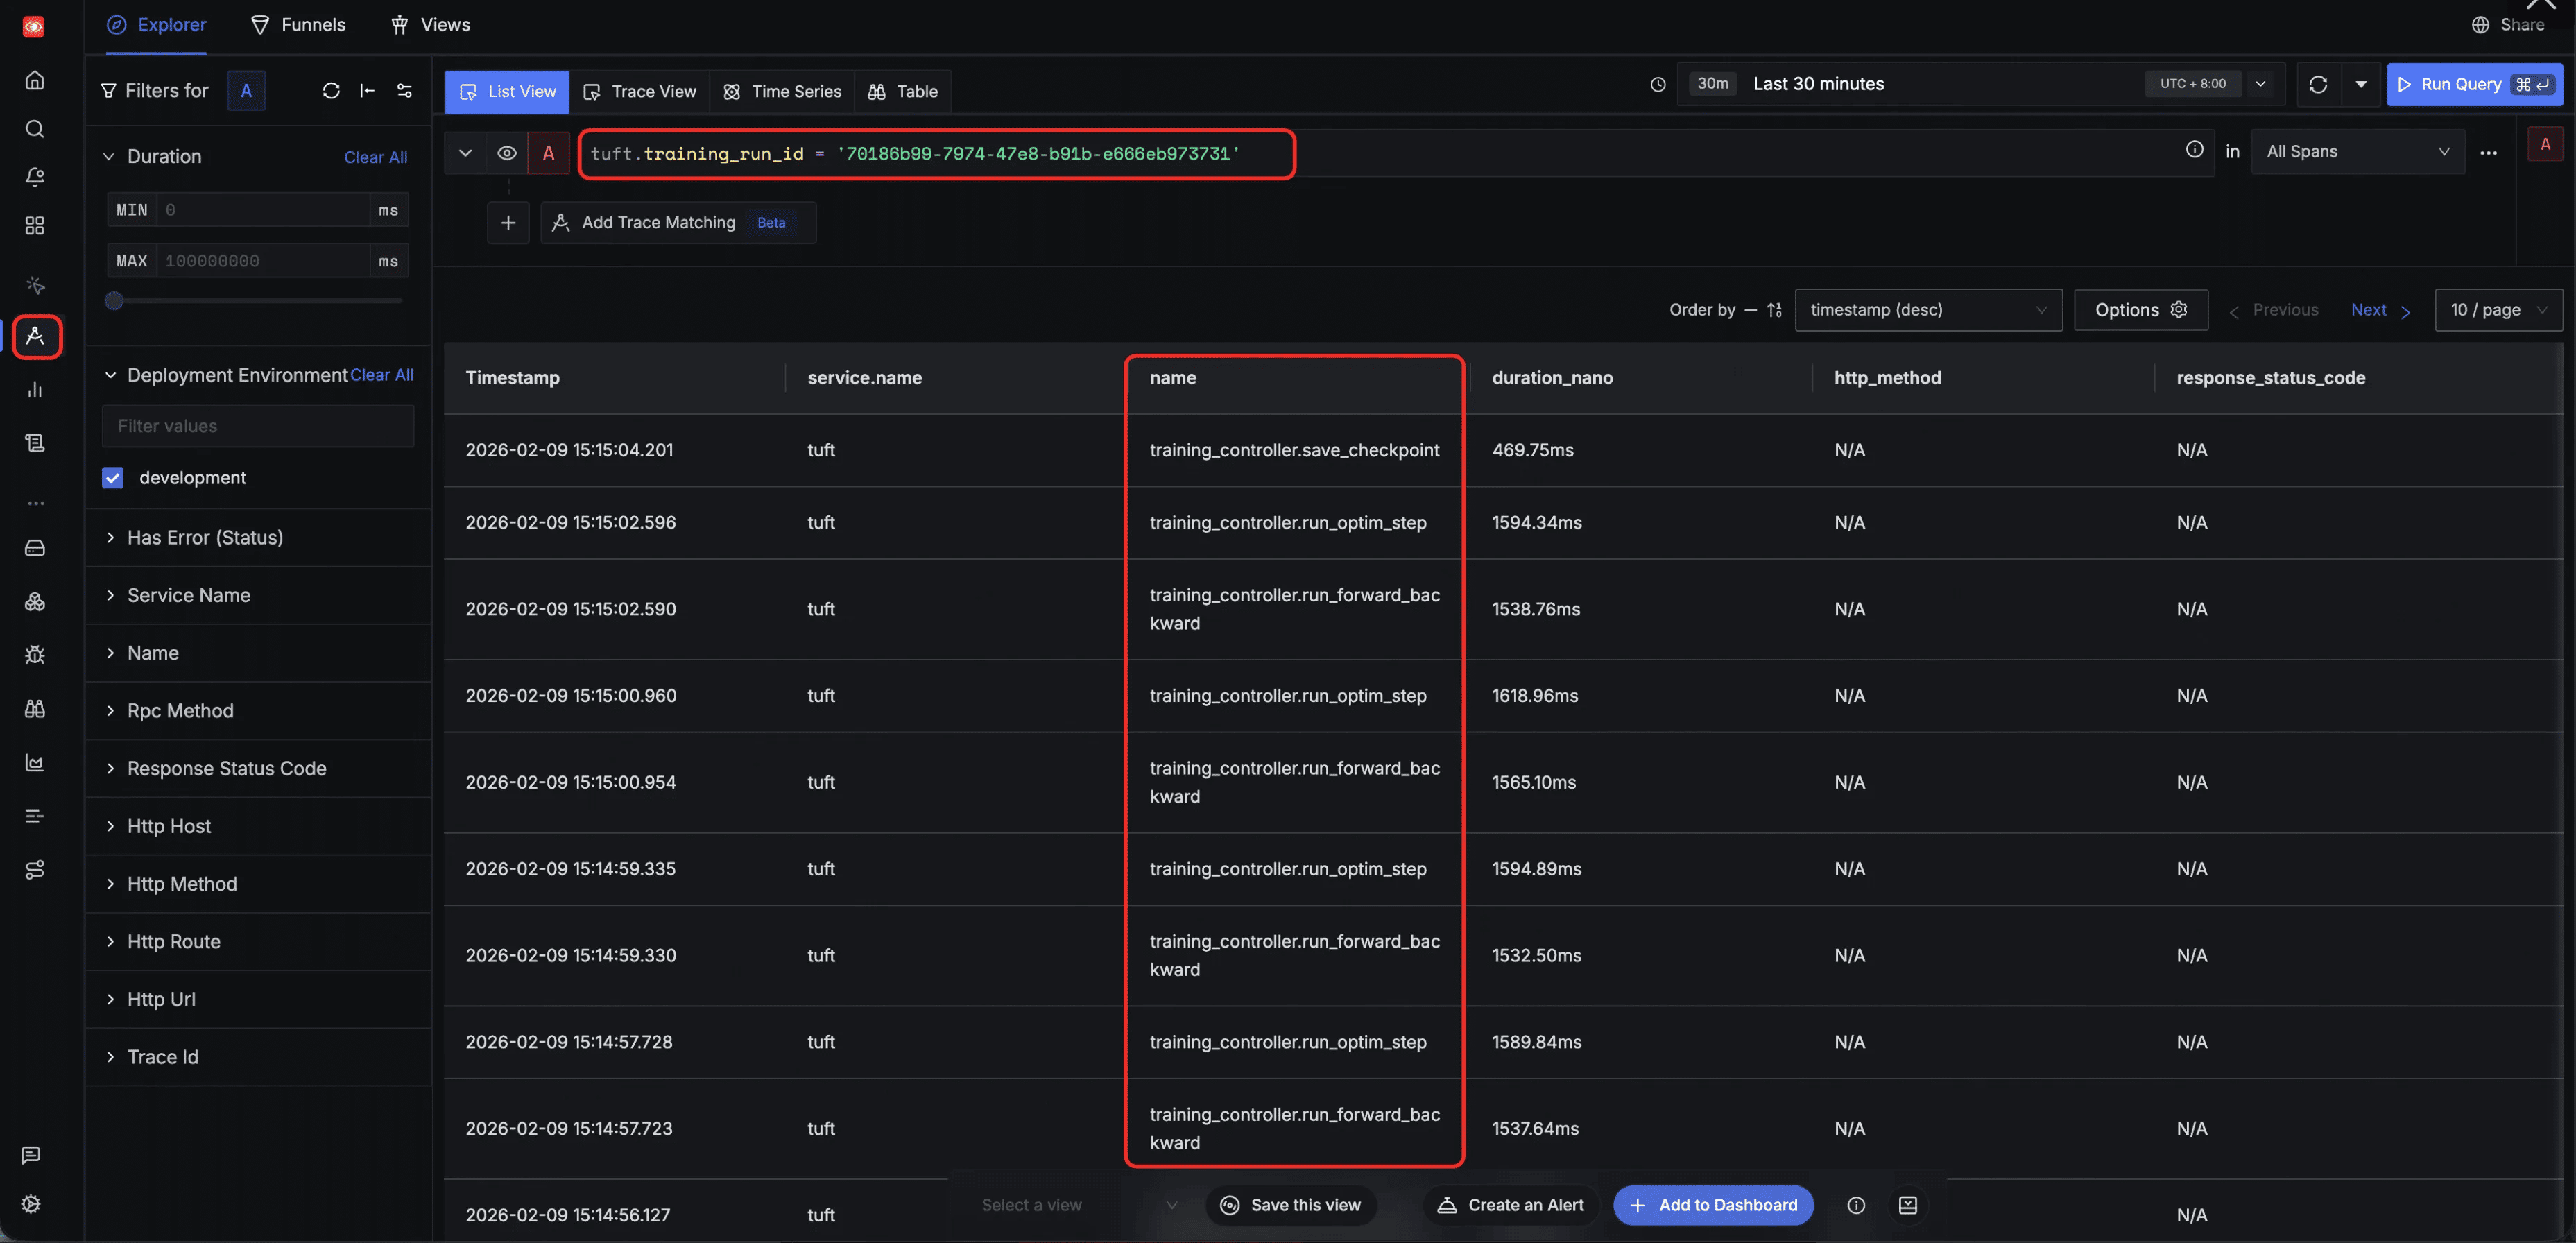
Filter by tuft.training_run_id — track all tasks belonging to a specific training client. Filtering by tuft.training_run_id isolates the full lifecycle of a specific training client, showing training operations such as run_forward_backward, run_optim_step, and save_checkpoint along with their execution order:
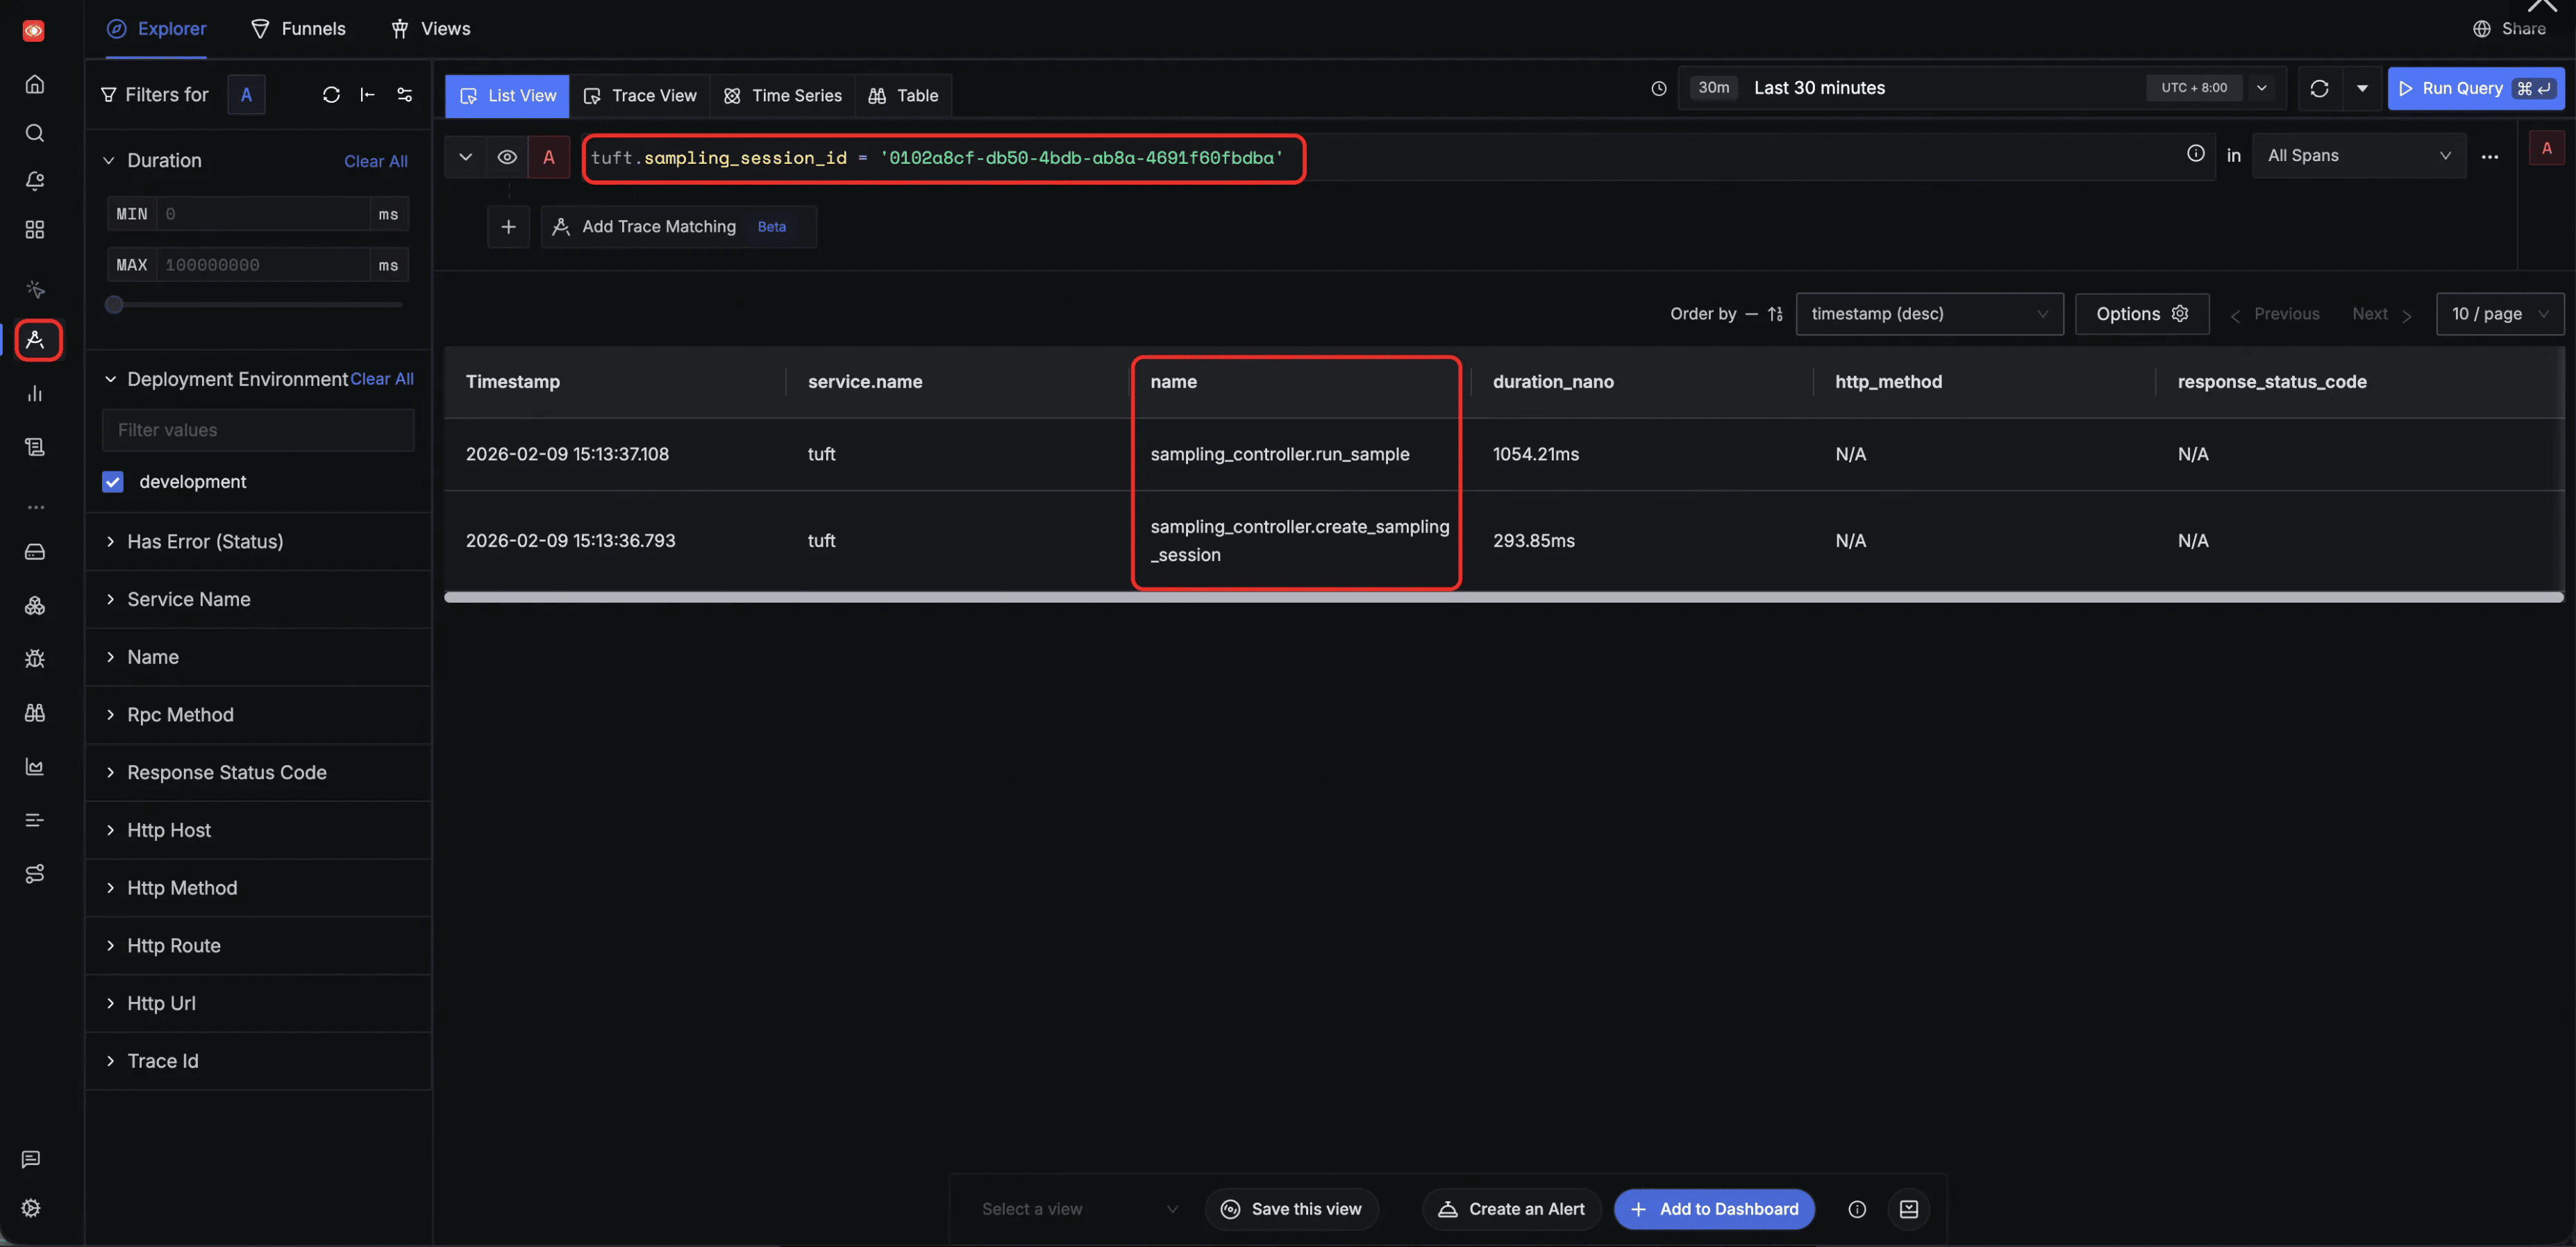
Filter by tuft.sampling_session_id — track all tasks belonging to a specific sampling client. Filtering by tuft.sampling_session_id narrows the view to spans from a single inference session, such as sampling_controller.run_sample and sampling_controller.create_sampling_session:
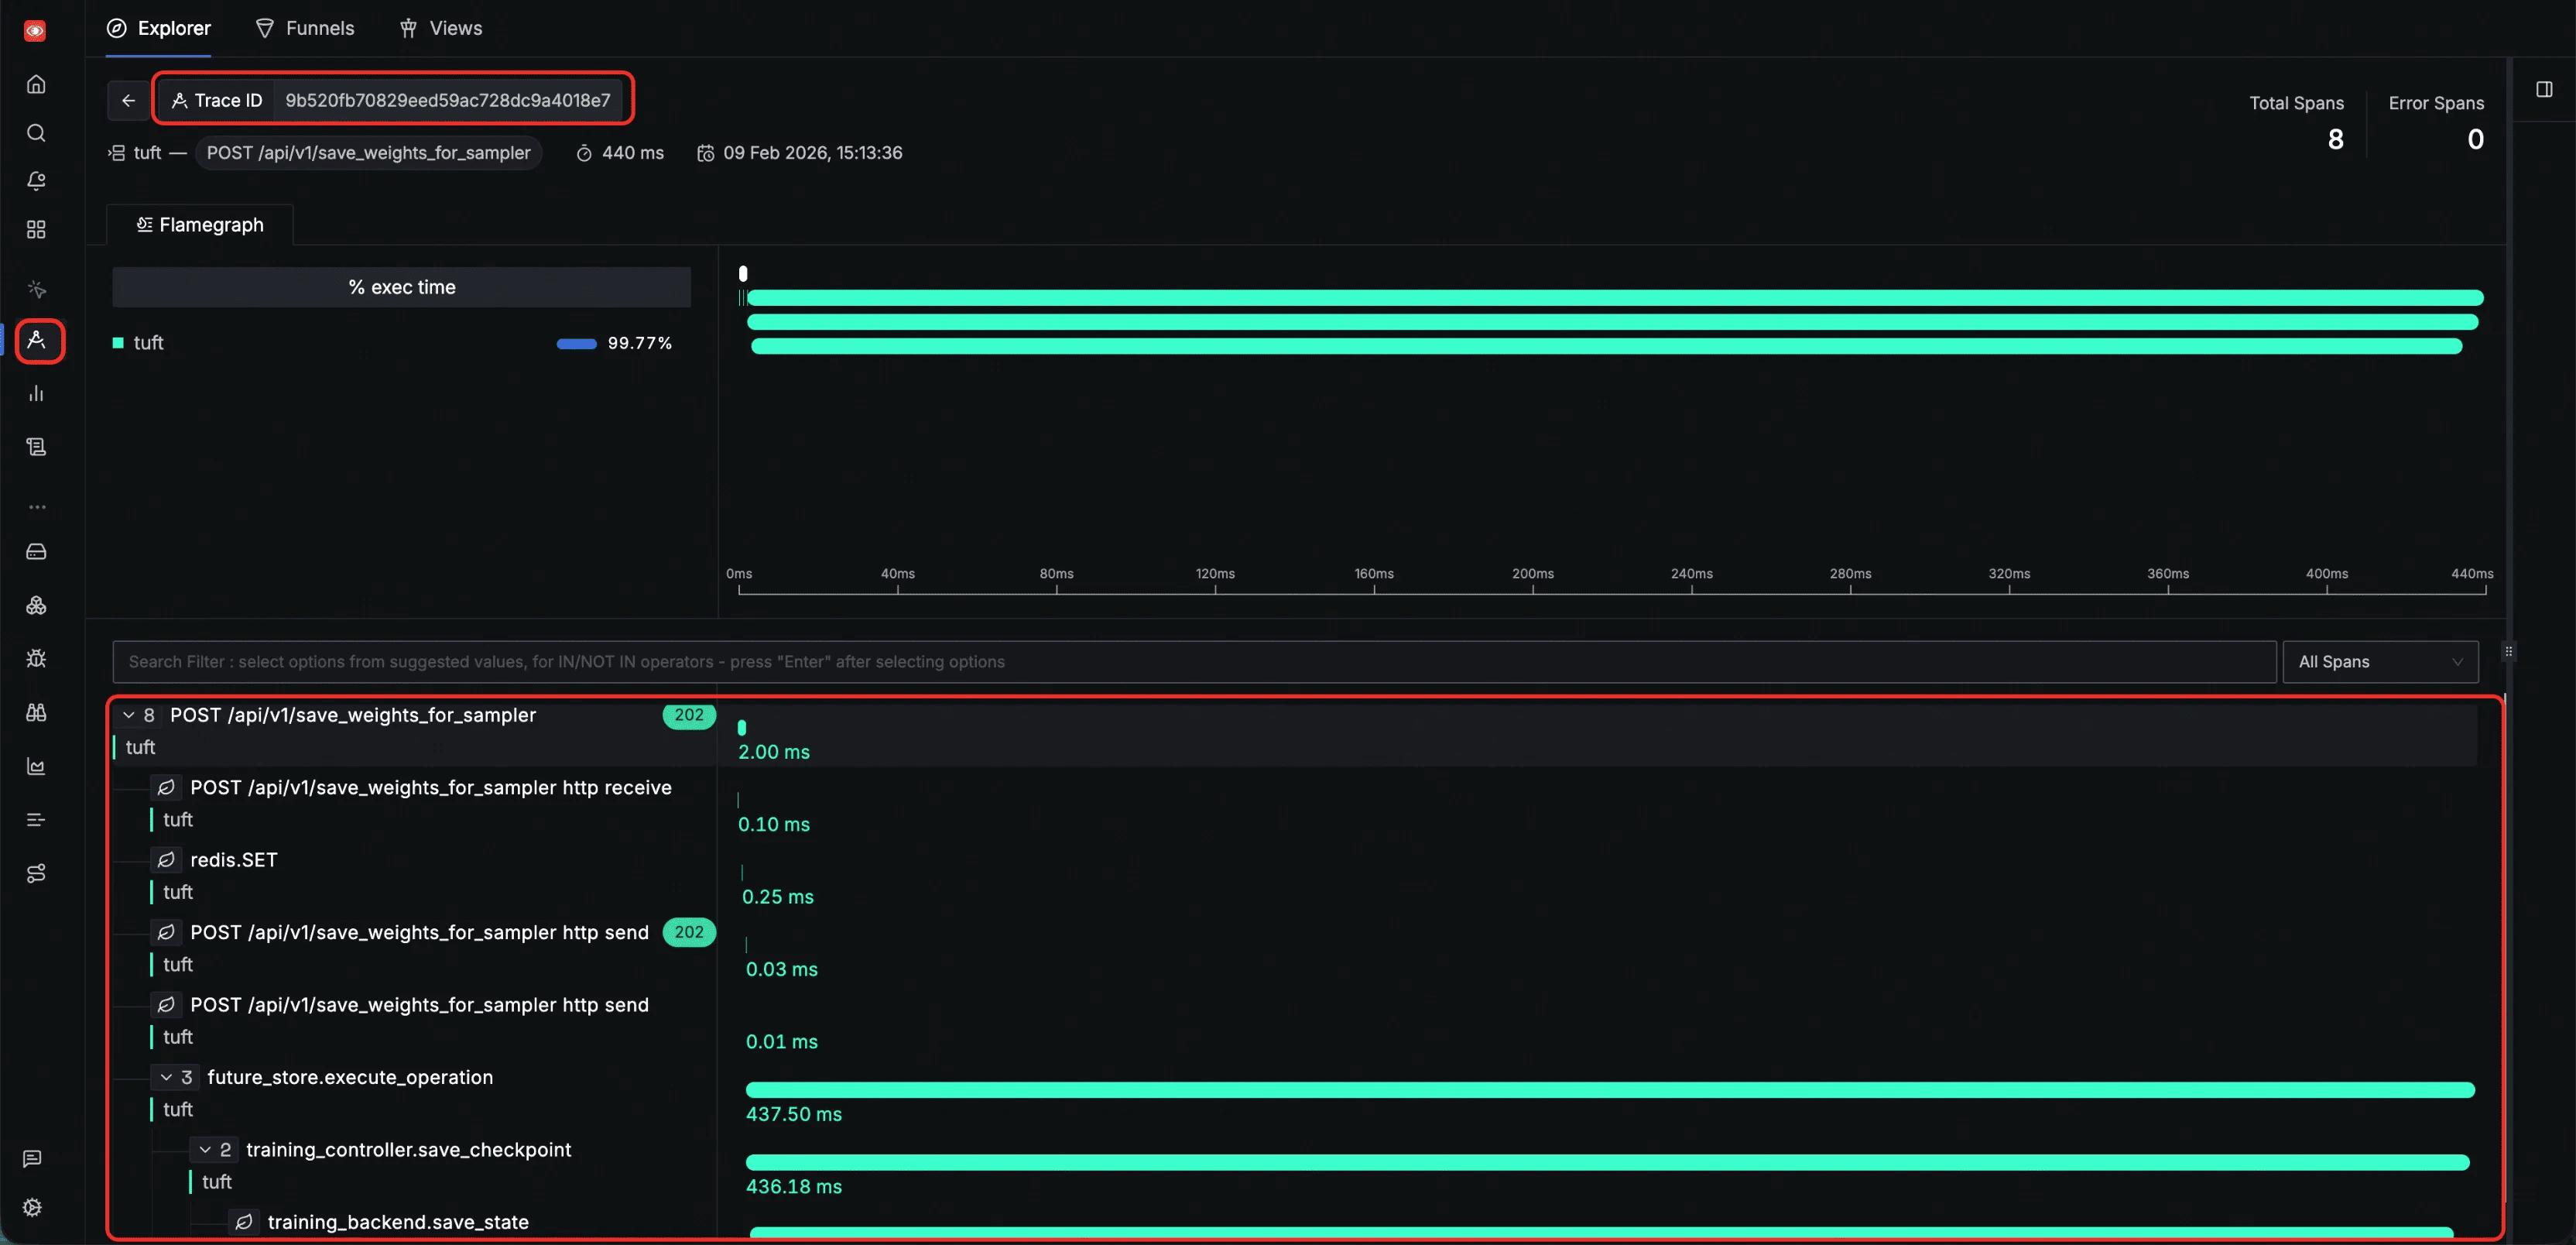
Inspect a single HTTP request trace — all spans generated during one HTTP request share the same trace ID, allowing you to view the complete execution path of that request. The flamegraph below shows the span tree from HTTP receive through internal processing, state persistence, and backend execution:
Logs
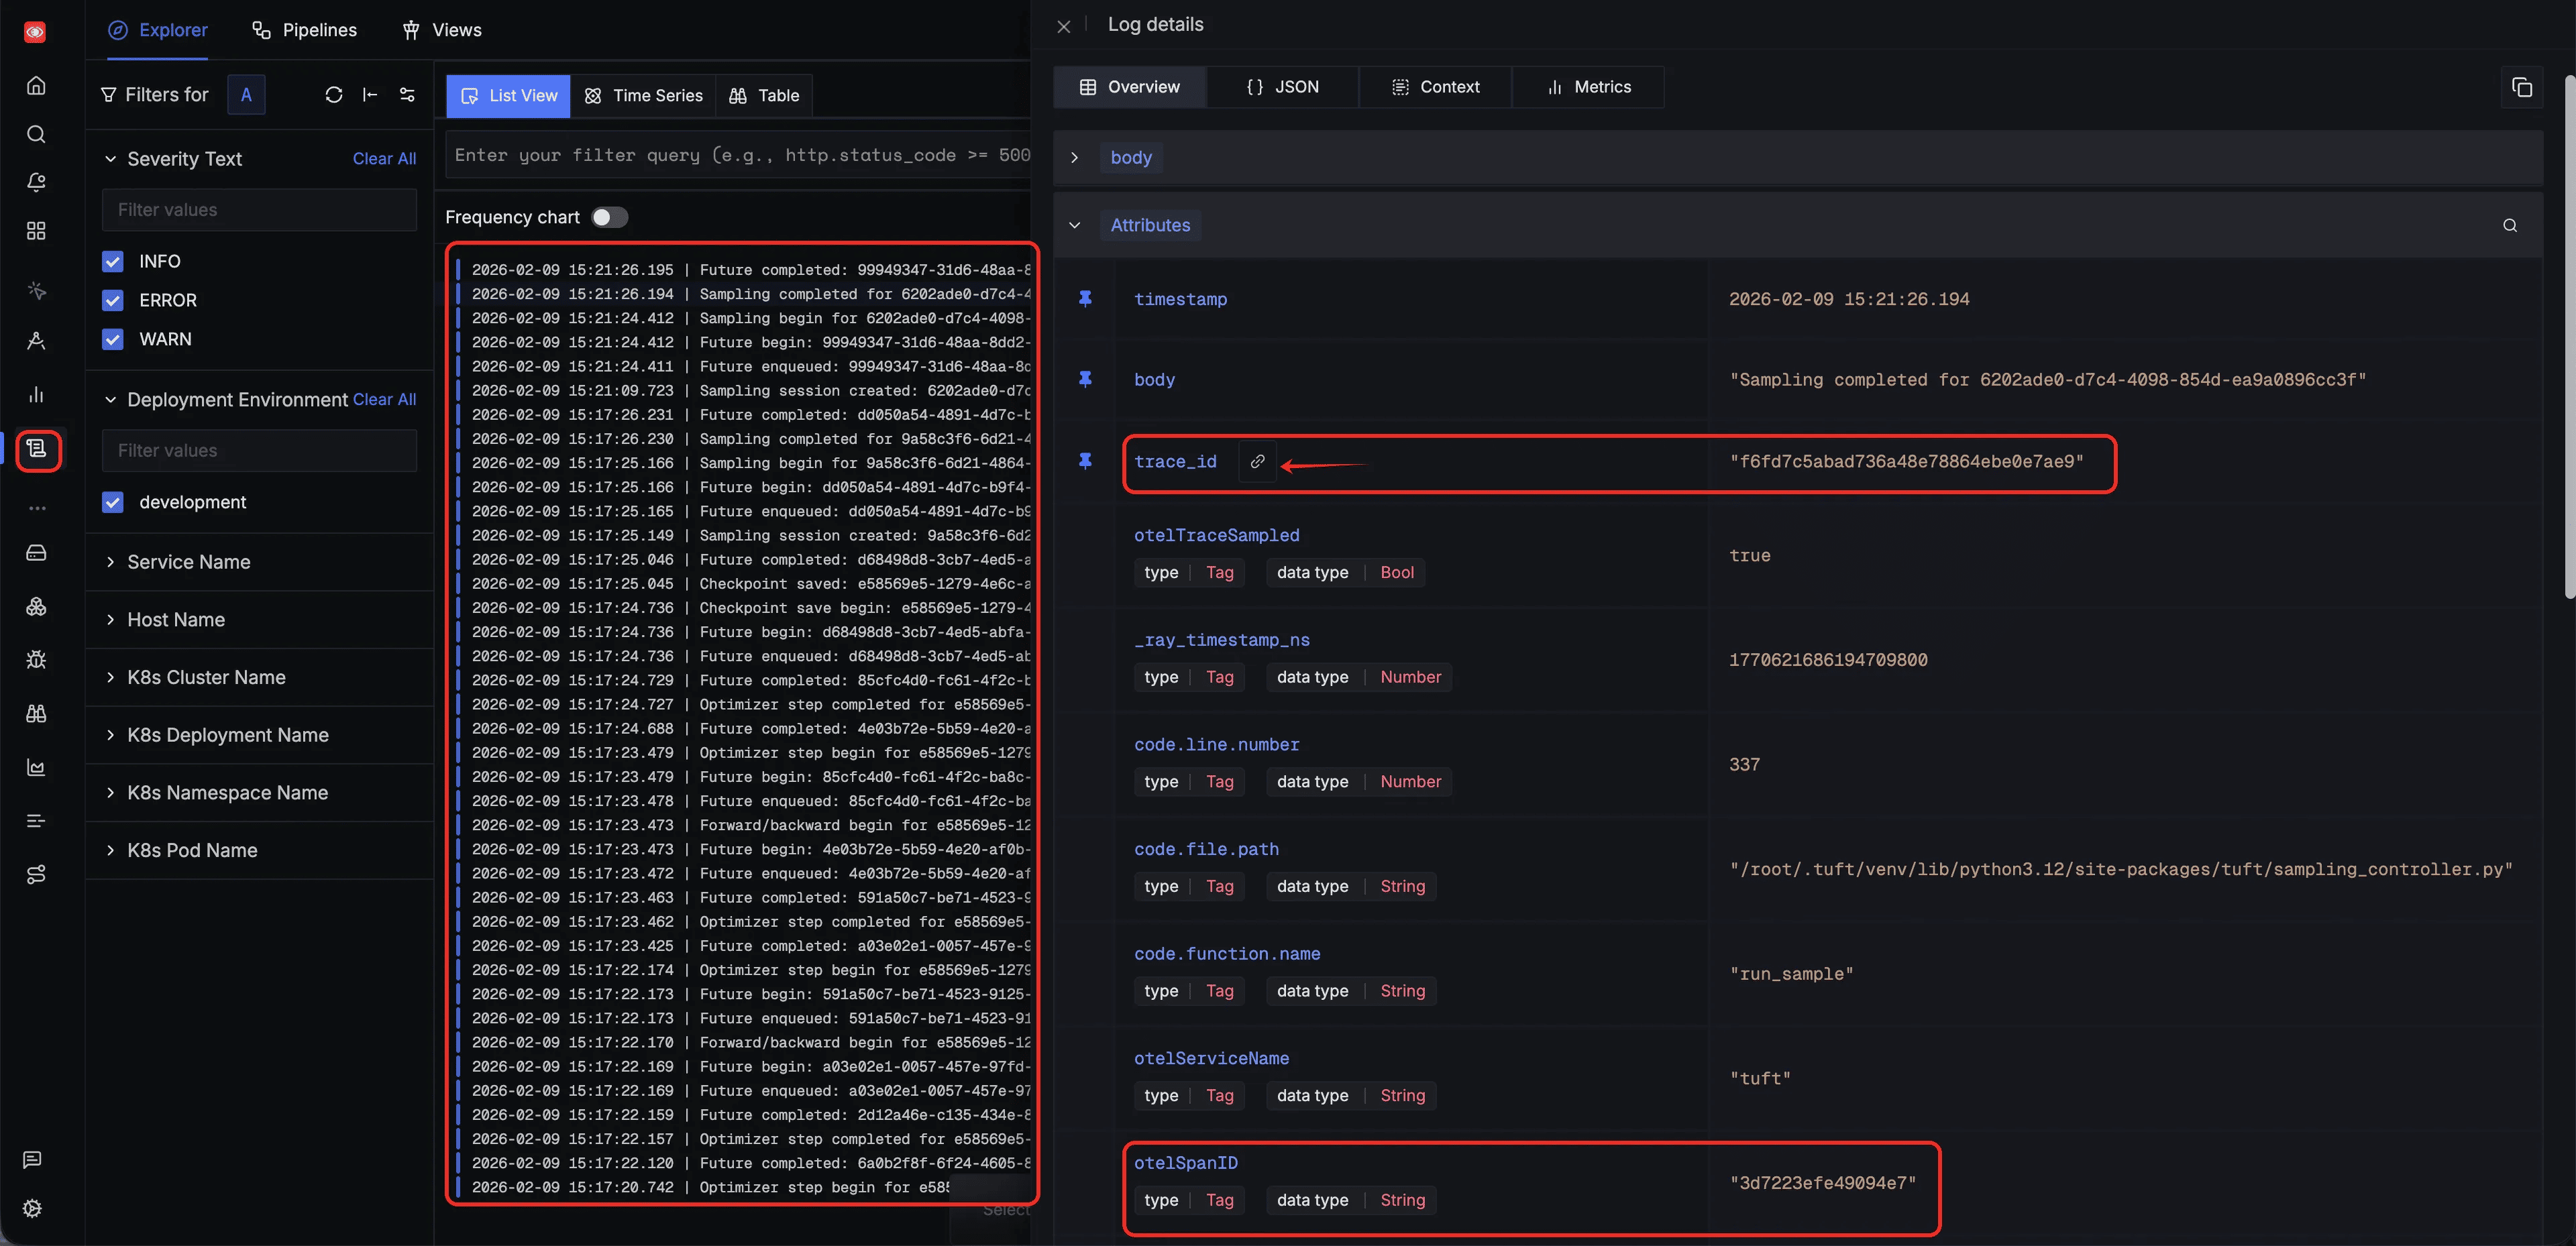
Every log entry emitted by TuFT is automatically correlated with a span ID and trace ID. You can use these two identifiers to pinpoint the exact operation step a log belongs to, or navigate in reverse — from a span to all logs produced during that operation:
Metrics
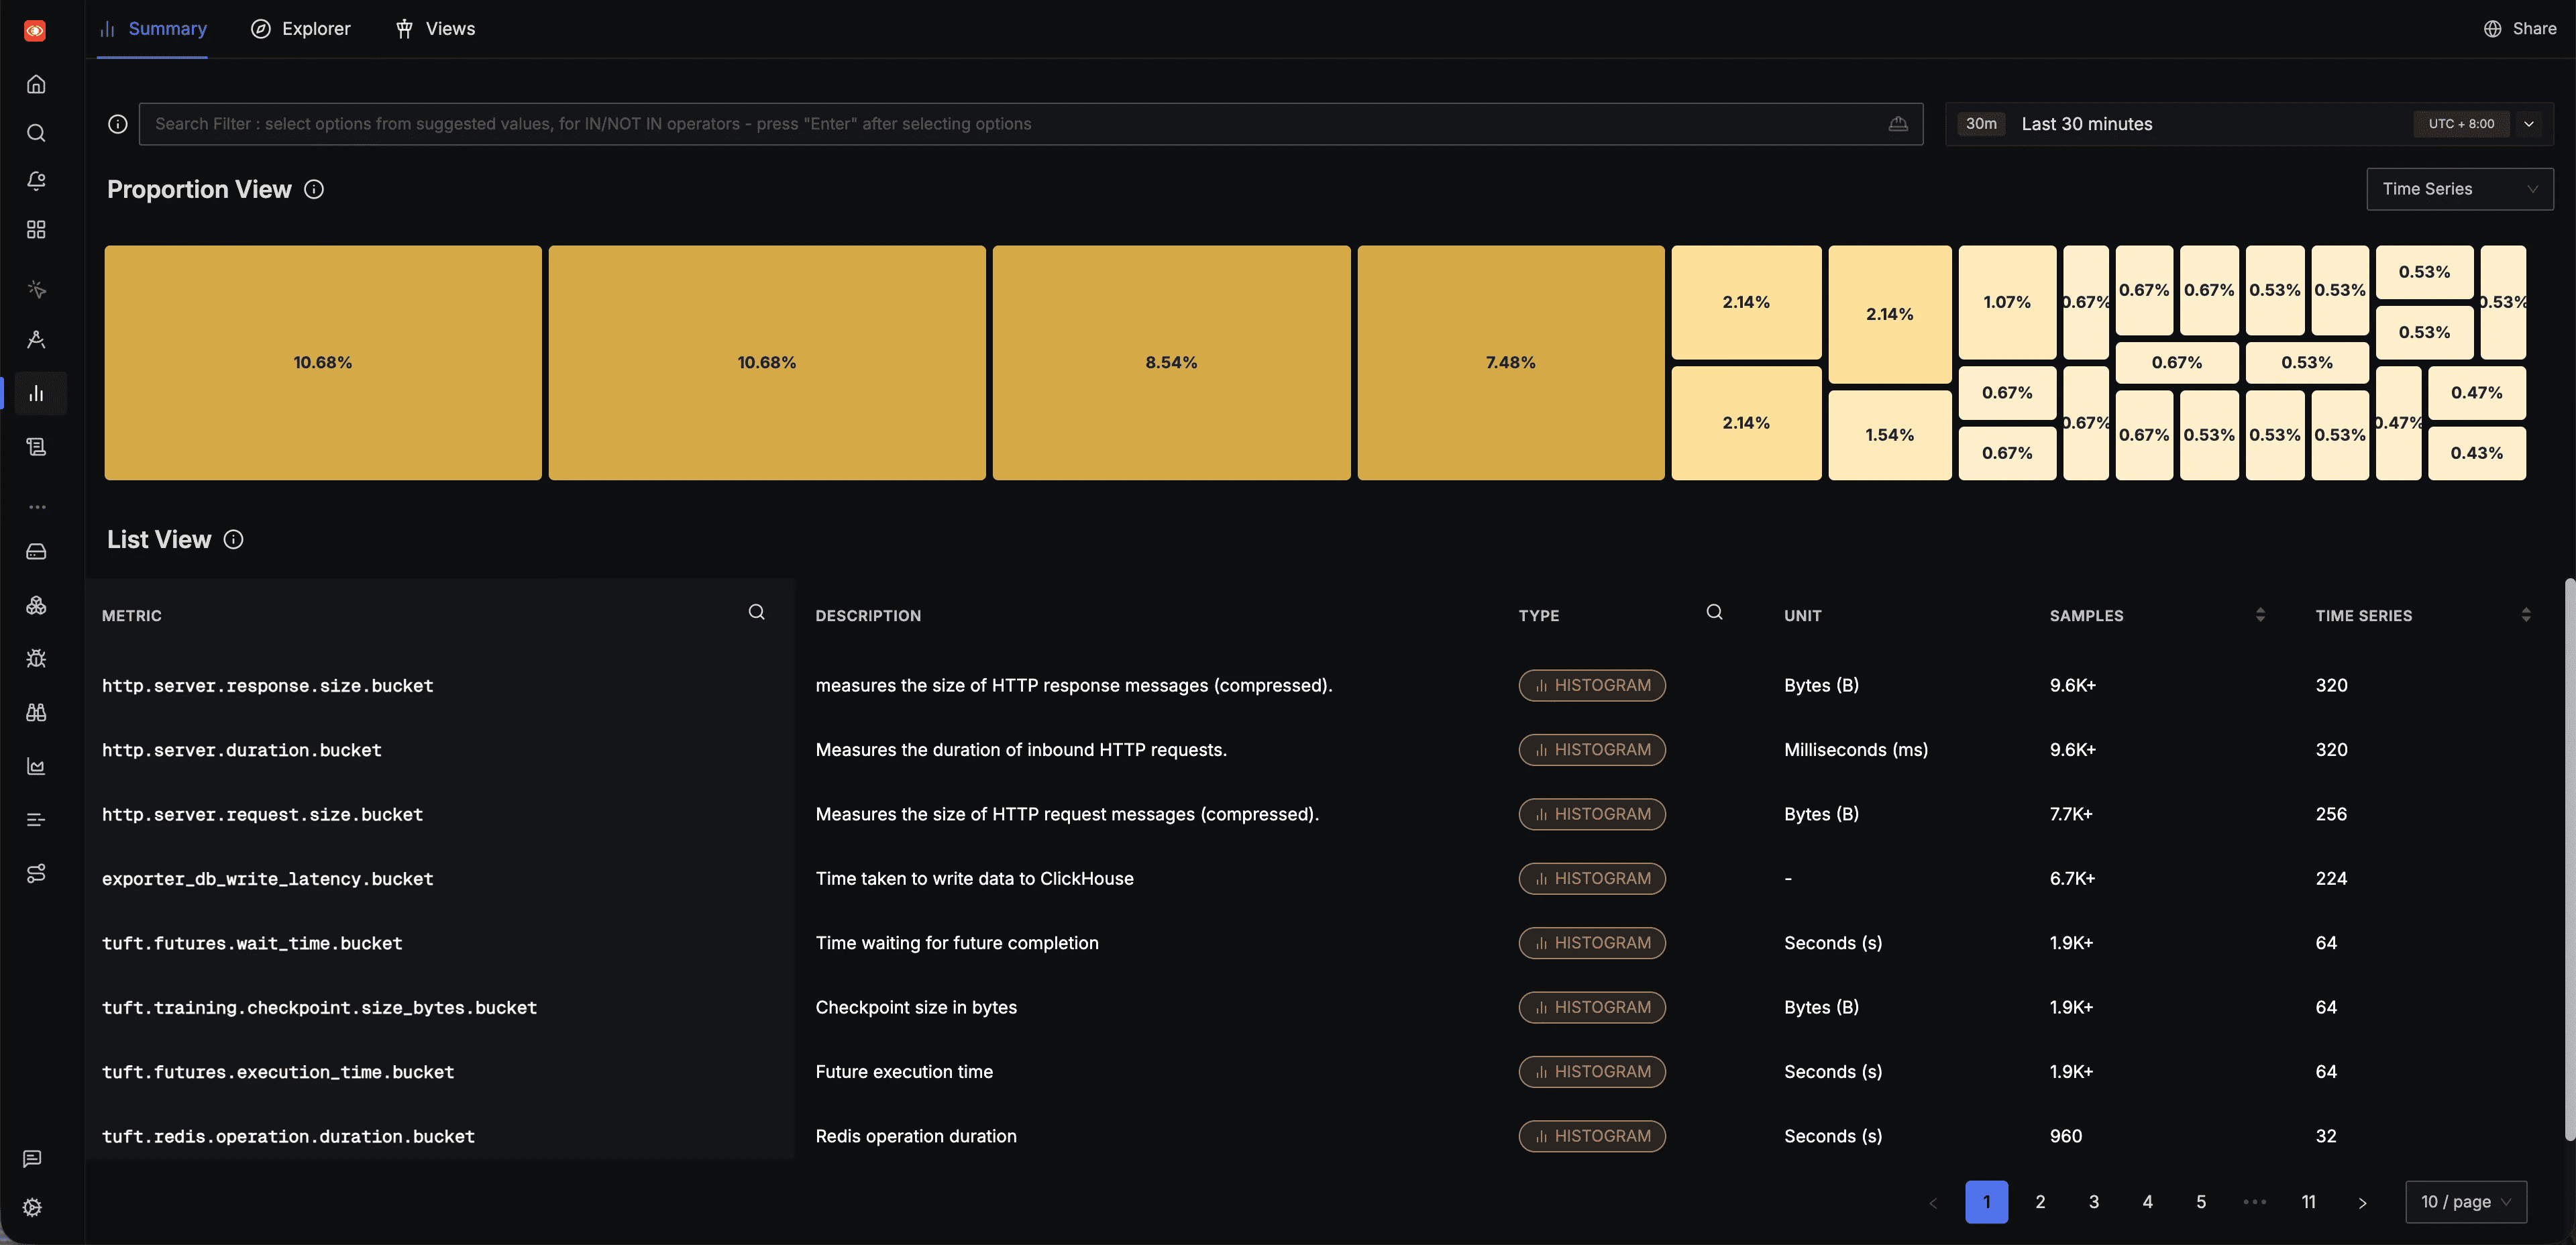
All metrics emitted by TuFT can be browsed in the SigNoz Metrics page, which lists every metric along with its type, unit, and sample count:
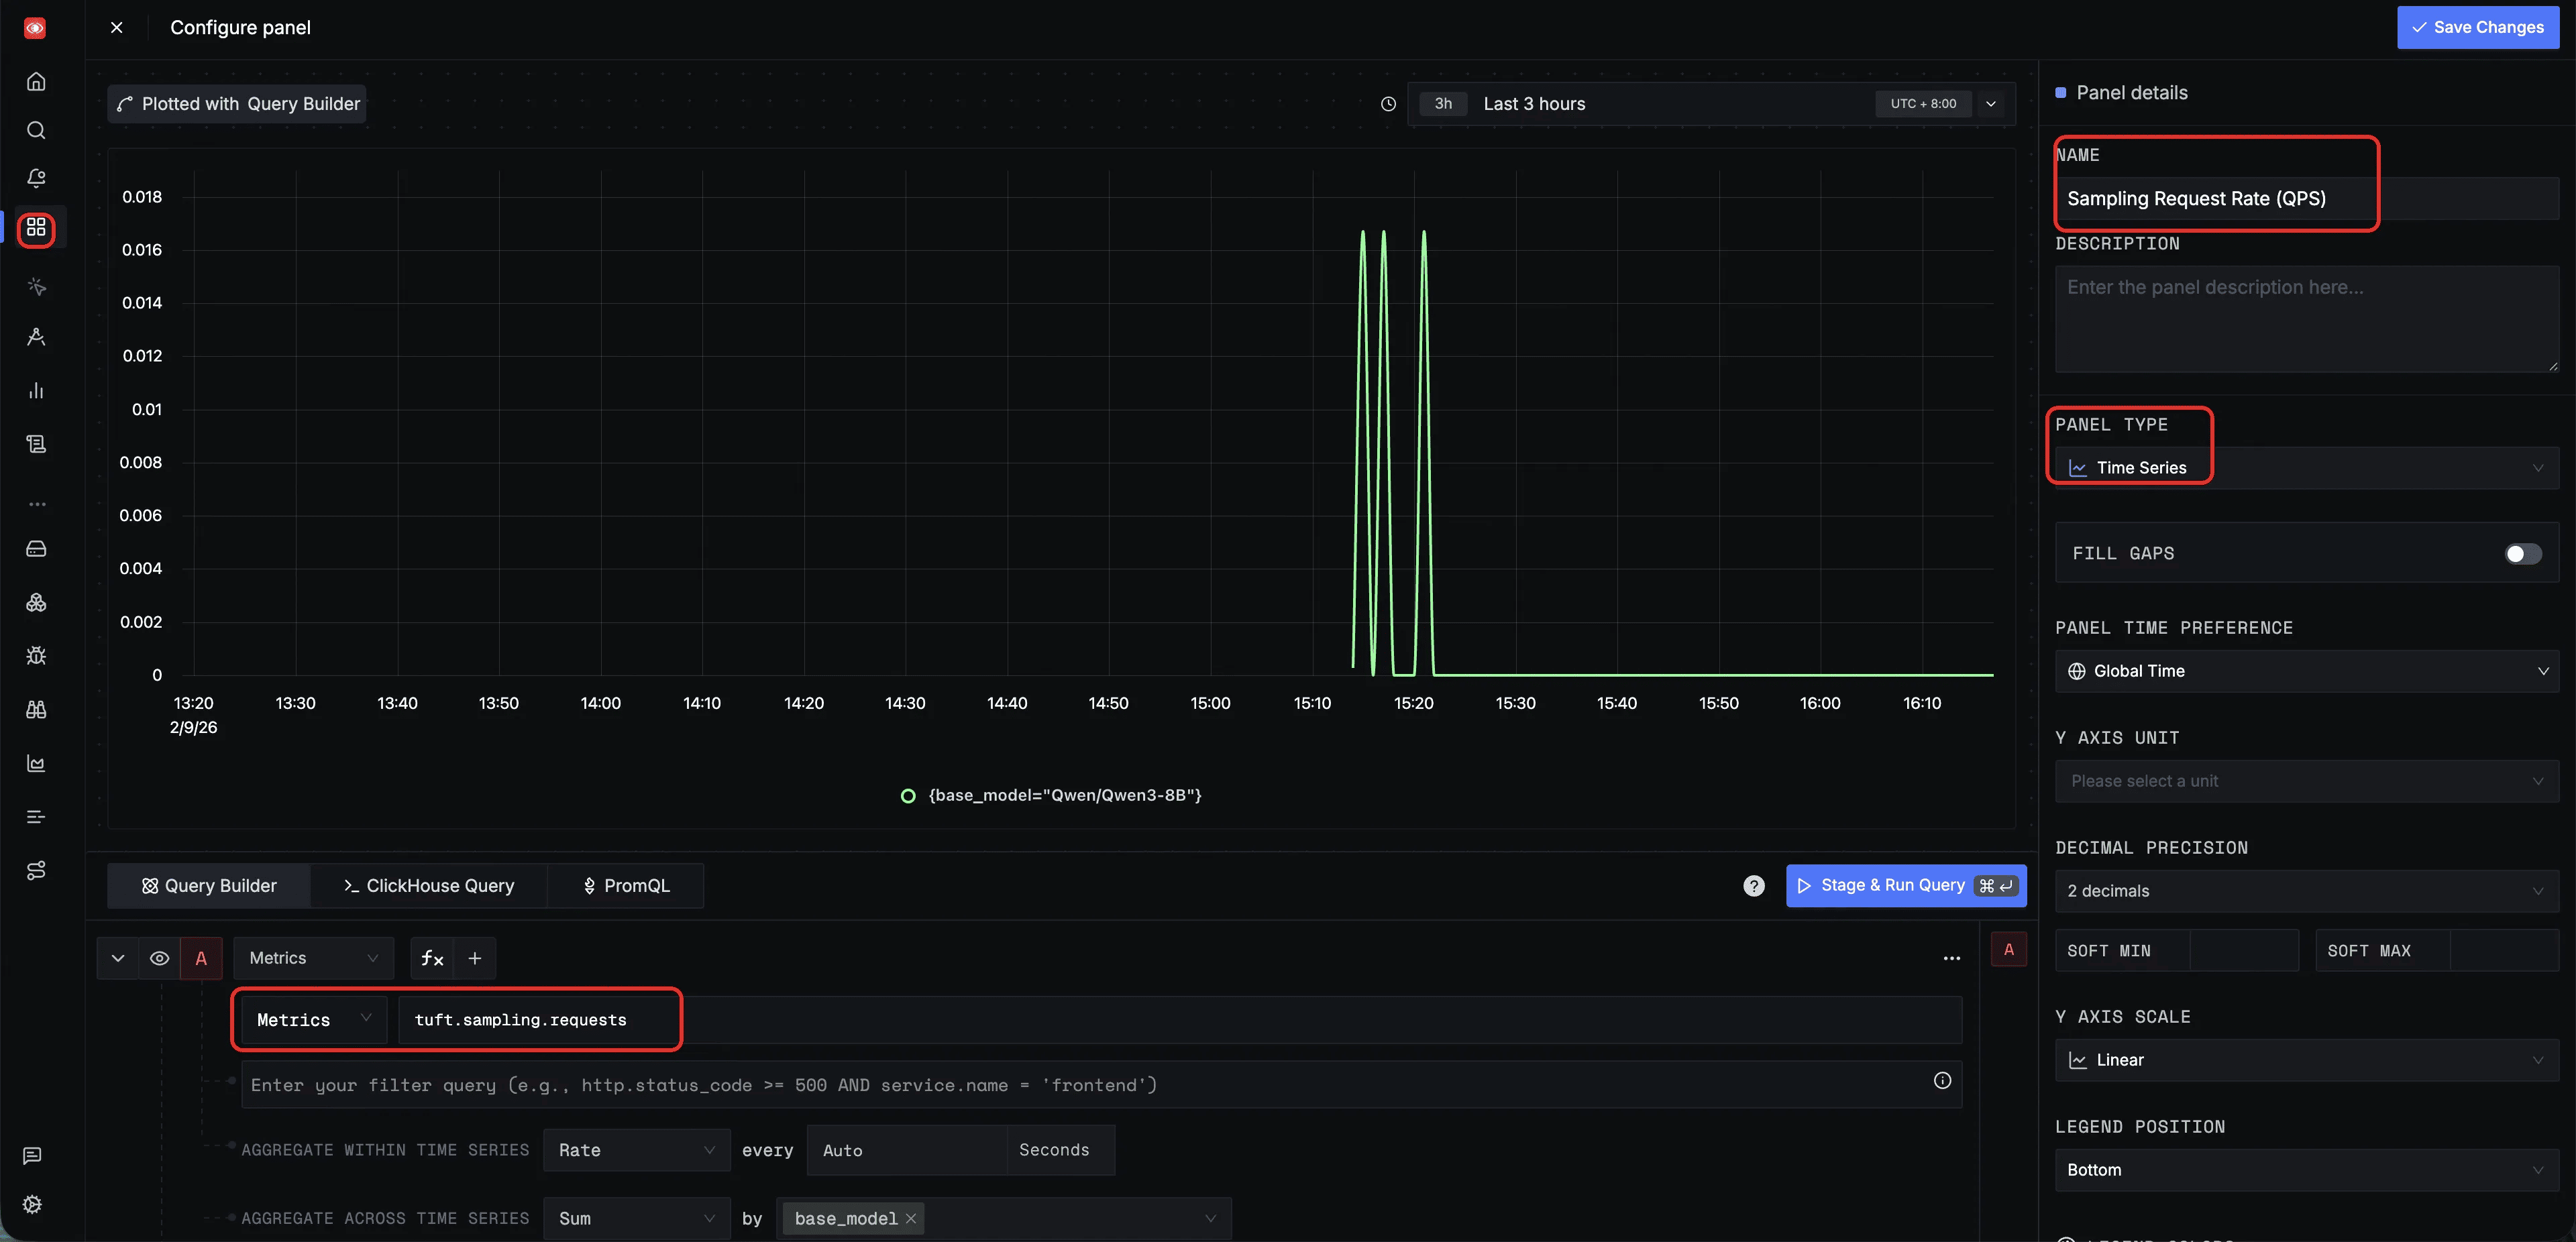
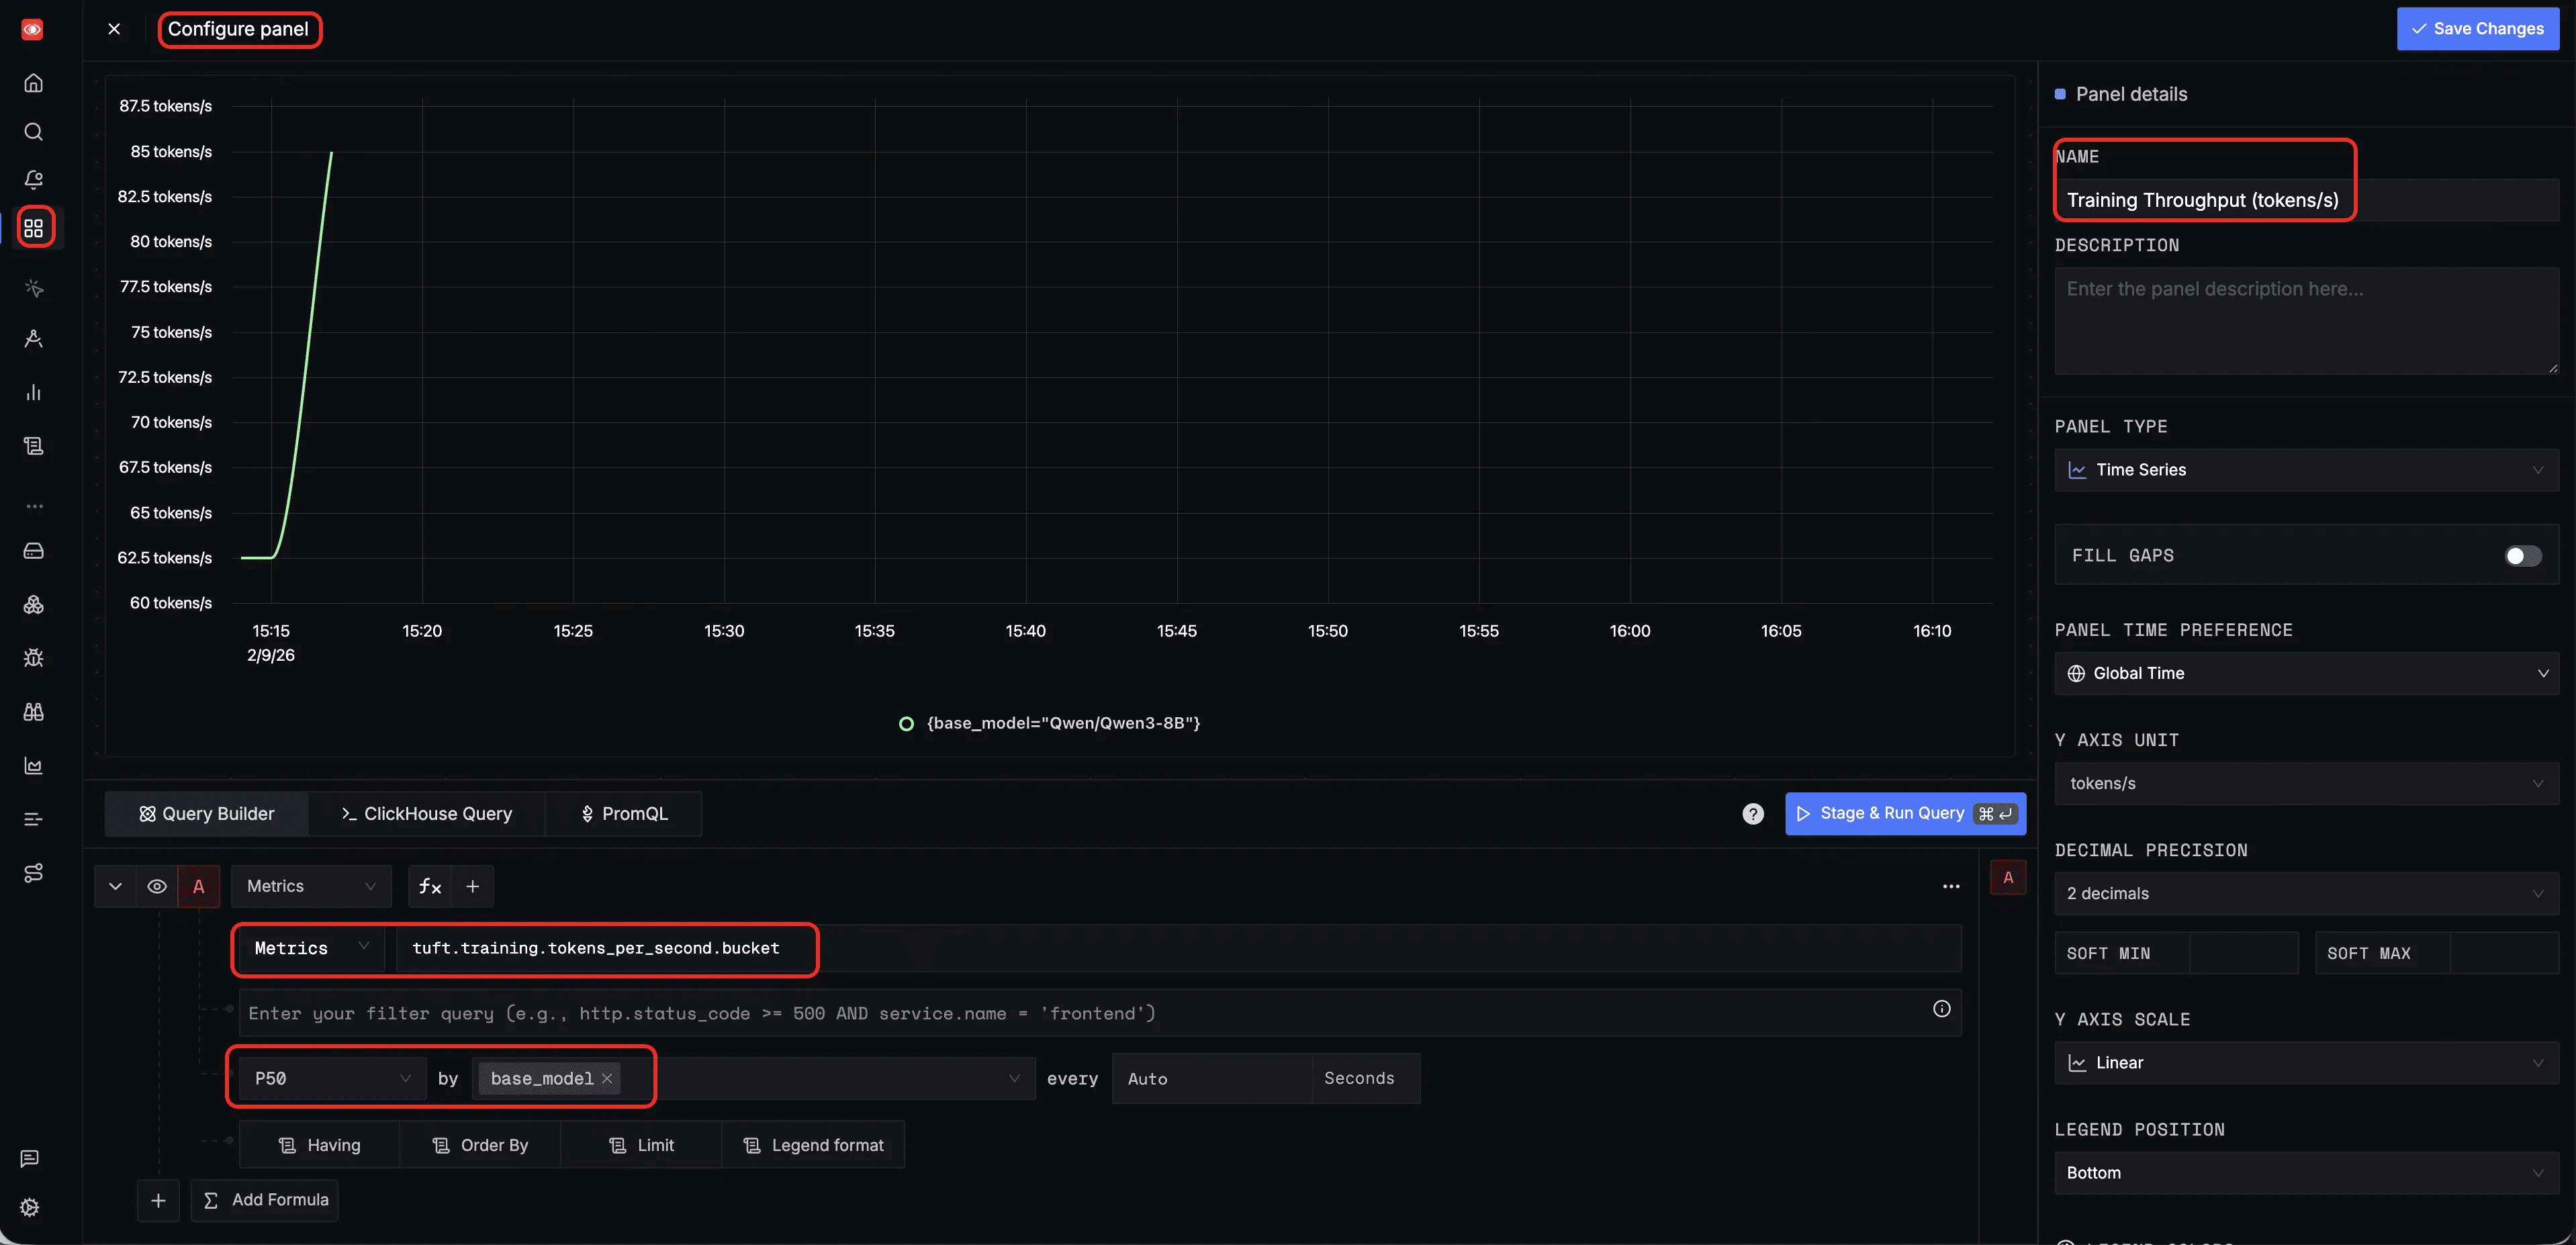
You can also configure custom panels in the SigNoz Dashboard to monitor specific metrics. Below are two example panel configurations for training throughput and sampling QPS; additional panels can be created to suit your specific monitoring needs.
Training throughput (tokens/s) — a dashboard panel querying tuft.training.tokens_per_second with P50 aggregation, grouped by base_model, to monitor training efficiency over time:
Sampling request rate (QPS) — a dashboard panel querying tuft.sampling.requests with Rate aggregation, grouped by base_model, to monitor inference throughput and detect traffic spikes: